
Fig. S3
- ID
- ZDB-FIG-170306-13
- Publication
- Gays et al., 2017 - An exclusive cellular and molecular network governs intestinal smooth muscle cell differentiation in vertebrates
- Other Figures
- All Figure Page
- Back to All Figure Page
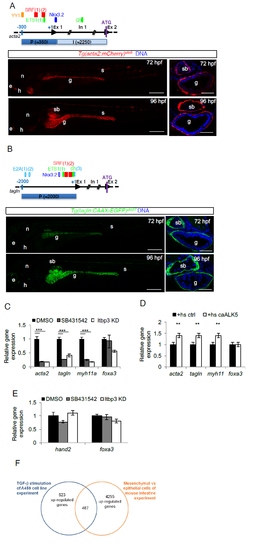
TGF-β is required for LPM-to-iSMC differentiation. a) Tg(acta2:mCherry)uto5 line marks iSMCs. Schematic representation of the zebrafish acta2 minimal promoter region (P) and first intron (I) used to generate the Tg(acta2:mCherry)uto5 line. The SM-relevant transcriptional regulatory elements conserved between zebrafish, humans and mice are depicted. They are: ying yang1, YY1, serum response factor, SRF, v-ets avian erythroblastosis virus E26 oncogene homolog 1, ETS-1, and NK3 homeobox 2, Nkx3.2,. Scores and alignments are shown in Supplementary Table 1. Representative confocal images of whole embryos and of trunk sections show mCherry expression in the intestinal SMCs at the indicated developmental stages. Ectopic mCherry expression is also detected in the lateral line, anterior notochord, heart and few somites. Blue= DNA. Scale bars: left 200 μm and right 30 μm. e= eye; n= notochord; h= heart; g= gut; s= somite; sb= swim bladder. b) Tg(tagln:CAAX-EGFP)uto37 line marks iSMCs. Schematic representation of the zebrafish tagln promoter region (P) used to generate the Tg(tagln:CAAX-EGFP)uto37 line. The SM-relevant transcriptional regulatory elements (TFBSs) YY1, SRF, ETS, transcription factor E2-alpha, E2A and Nkx3.2 conserved between fishes are depicted. Empty boxes show TFBSs conserved between at least 2 species, whereas filled boxes represent TFBSs conserved between all fishes considered in the study (i.e., zebrafish, medaka, stickleback and tetraodon). Scores and alignments are shown in Supplementary Table 1. Representative confocal images of whole embryos and of trunk sections show a membrane localized EGFP expression in the intestinal SMCs at the indicated developmental stages. Ectopic EGFP expression is also detected in the lateral line, anterior notochord, heart and few somites Blue= DNA. Scale bars: left 200 μm and right 30 μm. e= eye; n= notochord; h= heart; g= gut; s= somite; sb= swim bladder. c) TGF-β signaling inhibition blocks iSMC marker expression. Histograms show acta2, tagln, myh11, and foxa3 mRNA levels measured by qRT-PCR in the trunk of 72 hpf embryos after pharmacological and genetic TGF-β signaling blockade. The iSMC markers acta2, tagln and myh11 were significantly downregulated, whereas the endodermal marker foxa3 was only partially affected. Stars represent the results of one way-ANOVA-Dunnett's Post Hoc test (*p<0.05, **p<0.01, ***p<0.001). d) TGF-β signaling promotes iSMC marker expression. Histograms show acta2, tagln, myh11, foxa3 mRNA levels measured at 72 hpf in the trunk of Tg(hsp70:caALK5) embryos by qRT-PCR after Alk5 activation. The iSMC markers acta2, tagln and myh11 were upregulated, whereas the endodermal marker foxa3 was unaffected. Stars represent the results of one way-ANOVA-Dunnett's Post Hoc test (*p<0.05, **p<0.01, ***p<0.001). e) TGF-β signaling inhibition does not alter LPM differentiation. Histograms show hand2 and foxa3 mRNA levels in the trunk of 48 hpf embryos measured by qRT-PCR after pharmacological and genetic TGF-β signaling blockage. TGF-β blockade does not alter the LPM (hand2-positive cells) or endodermal (foxa3-positive cells) compartment. Stars represent the results of unpaired t-tests of mean difference = 0 (*p<0.05, **p<0.01, ***p<0.001) f) Venn diagram showing the strategy for the selection of zeb1a and foxo1a as genes regulated by TGF-β and expressed in the embryonic intestinal mesenchyme. Briefly, intestinal mesenchymal genes were defined by analyzing the microarray data of Li et al. (Li et al., 2007). We then selected those expressed only in the intestinal mesenchyme that could be regulated by TGF-β by analyzing the microarray data of Sartor et al. (Sartor et al., 2010). A total of 487 genes were found. |