
Fig. S4
- ID
- ZDB-FIG-170306-14
- Publication
- Gays et al., 2017 - An exclusive cellular and molecular network governs intestinal smooth muscle cell differentiation in vertebrates
- Other Figures
- All Figure Page
- Back to All Figure Page
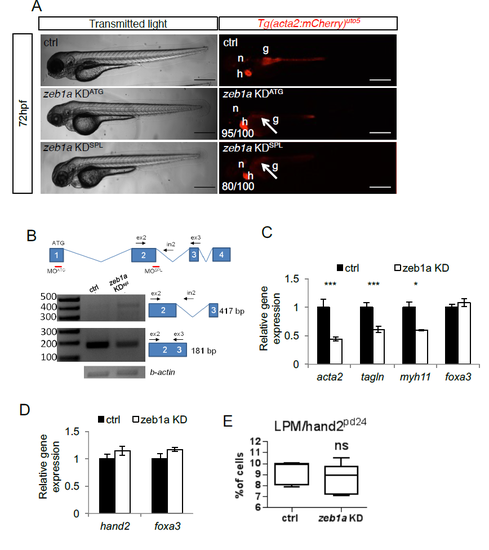
zeb1a is required to develop iSMCs in zebrafish embryos. a) zeb1a knockdown impairs iSMC development. Bright-field and fluorescent images of Tg(acta2:mCherry)uto5 embryos injected with two different morpholinos (KDATG and KDspl). Zeb1a KD in zebrafish did not alter embryonic development, although small moderate pericardial edema and craniofacial abnormalities were evident at 72 hpf. By contrast, zeb1a-deficient embryos displayed no iSMC development, as shown in Tg(acta2:mCherry)uto5-injected embryos (arrows). The number of embryos showing the phenotype is indicated. Scale bar, 200 μm. Notochord: n; heart: h. b) Schematic diagram of the first 4 zeb1a exons (not to scale) showing the locations of binding sites of two different zeb1a morpholinos, one targeting the initiation codon (KDATG) and the other targeting the spice donor site for intron 2 (KDspl). Black arrows indicate the primer used. As shown in the RT-PCR experiments, zeb1a KDspl-injected embryos displayed altered zeb1a wild-type mRNA expression. c) zeb1a knockdown reduces iSMC marker expression. Histograms show acta2, tagln, myh11, and foxa3 mRNA levels in the trunk of 72 hpf embryos measured by qRT-PCR after zeb1a KD. The iSMC markers acta2, tagln and myh11 were significantly downregulated, whereas the endodermal compartment (foxa3) was normal. Stars represent the results of unpaired t-tests of mean difference = 0 (*p<0.05, **p<0.01, ***p<0.001). d) zeb1a knockdown does not alter LPM and endodermal differentiation. Histograms show that the hand2 and foxa3 mRNA levels measured in the trunks of 48 hpf embryos by qRT-PCR after zeb1a KD were equal to control levels. Stars represent the results of unpaired t-tests of mean difference = 0 (*p<0.05, **p<0.01, ***p<0.001) e) zeb1a knockdown does not alter LPM/hand2+ cell number. Box and whisker plots show the percentage of LPM cells isolated by fluorescent-activated cell sorting (FACS) experiments from the trunks of Tg(hand2:EGFP)pd24 embryos at 48 hpf after zeb1a KD. Zeb1a KD did not alter LPM/hand2+ cell number. The boxplots show the maximum, minimum, upper and lower quartiles, and the sample median. Stars represent the results of unpaired t-tests of mean difference = 0 (*p<0.05, **p<0.01, ***p<0.001). (Left to right) n = 5 and n = 10 groups of 10-20 embryos. |