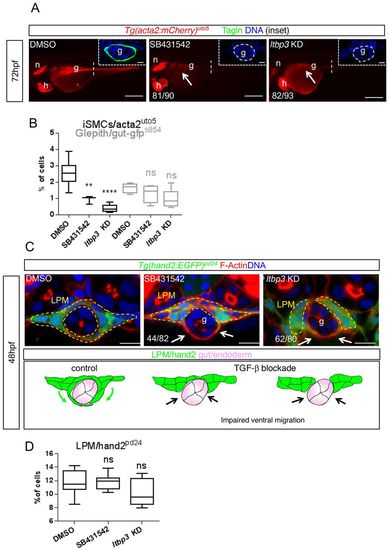
LPM migration is guided by TGFβ signaling. (A) Pharmacological and genetic TGFβ signaling blockade impairs iSMC differentiation. Fluorescent images of Tg(acta2:mCherry)uto5 embryos treated with SB431542 (a TGFβ type I receptors inhibitor) or ltbp3 knockdown (encoding a protein that regulates the bioavailability of TGFβ ligands) exhibit no or few iSMCs, as evaluated by mCherry and Tagln expression in the gut region (g) (arrow) at 72 hpf. Scale bars: 200 μm. n, notochord; h, heart. Insets show confocal transverse sections of posterior gut regions (dashed vertical line) of SB431542-treated embryos and embryos injected with ltbp3 morpholino and stained for Tagln (green). The numbers of embryos showing the phenotype are indicated. Blue indicates nuclei. Scale bars in insets: 10 μm. (B) Alk5 blockade does not affect endoderm development and differentiation. Box and whisker plots show the percentage of iSMCs or endodermal cells isolated by fluorescent-activated cell sorting (FACS) experiments from the trunks spanning from somite 1 to 13 of the double Tg(acta2:mCherry)uto5 (Xia.Eef1a1:GFP)s854 embryos at 72 hpf after chemical (SB431542) or genetic (ltbp3 KD) Alk5 signaling blockade. The boxplots show the maximum, minimum, upper and lower quartiles, and the sample median. Asterisks represent the results of one-way ANOVA-Dunnett's post-hoc test (**P<0.01, ****P<0.0001; from left to right: n=8, n=3, n=5, n=5, n=5 and n=5 groups of 10-20 embryos). (C) Blockade of TGFβ signaling impairs LPM migration. Upper panel: confocal transverse sections of Tg(hand2:EGFP)pd24 stained with phalloidin (red) and Hoechst (blue) showing a reduced LPM migration at 48 hpf (arrows) after TGFβ inhibition. Scale bars: 15 μm. The number of embryos exhibiting this phenotype is indicated. Lower panel: schematic representation of impaired LPM migration (black arrows) observed with the lack of TGFβ signaling in zebrafish embryos. Green, LPM; pink, endoderm. (D) Alk5 blockade does not affect LPM. Box and whisker plots show the percentage of LPM cells isolated by fluorescent-activated cell sorting (FACS) experiments from the trunks of Tg(hand2:EGFP)pd24 embryos at 48 hpf after chemical (SB431542) or genetic (ltbp3 KD) Alk5 signaling inhibition. The boxplots show the maximum, minimum, upper and lower quartiles, and the sample median. From left to right: n=13, n=18 and n=10 groups of 10-20 embryos.
|
