
- Title
-
MEK Inhibitors Reverse Growth of Embryonal Brain Tumors Derived from Oligoneural Precursor Cells
- Authors
- Modzelewska, K., Boer, E.F., Mosbruger, T.L., Picard, D., Anderson, D., Miles, R.R., Kroll, M., Oslund, W., Pysher, T.J., Schiffman, J.D., Jensen, R., Jette, C.A., Huang, A., Stewart, R.A.
- Source
- Full text @ Cell Rep.
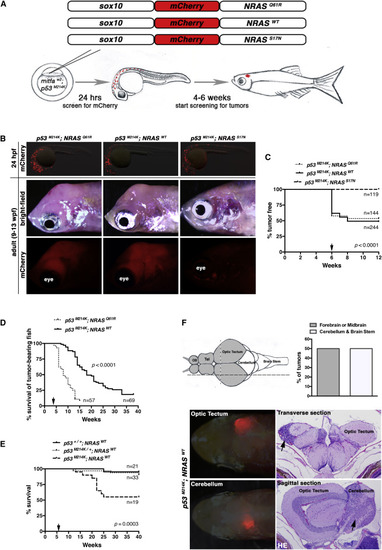
Oncogenic and WT NRAS Drive CNS Tumors in Zebrafish (A) Schematic of DNA constructs injected into one-cell-stage mitfaw2; p53M214K embryos and timeline for injections and screening of tumors arising from mosaic expression of the sox10:mCherry-NRAS constructs in (B)–(F). (B) Top panels show detection of chimeric expression of sox10:mCherry-NRAS constructs by immunofluorescence in lateral views of 24-hpf embryos to confirm injection efficiency. Only embryos that expressed mCherry at 24 hpf were raised for tumor and survival analysis in (C)–(E), but not all mCherry-expressing 24-hpf embryos would eventually develop tumors. Middle (bright-field) and bottom (mCherry) panels show a tumor mass arising in the head in NRASQ61R- and NRASWT-expressing fish but not NRASS17N-expressing fish. (C) Percentage of mitfaw2; p53M214K embryos injected with one of the indicated constructs that went on to develop tumors after 6 weeks (arrow). (D) Survival of tumor-bearing mitfaw2; p53M214K animals injected with indicated constructs analyzed after 4 weeks post-injection (arrow). (E) p53 dependence of NRASWT-driven tumors. The Tg(sox10:mCherry-NRASWT) construct was injected into embryos derived from an incross between mitfaw2; p53M214K/+ fish and analyzed for survival. Representative results from three independent injections are shown in (C)–(E). (F) Top left: schematic of zebrafish brain with forebrain and midbrain regions shaded gray, while cerebellum and brain stem are white. Olfactory bulb (OB) and telencephalon (Tel) are indicated. Vertical (stippled) and horizontal (dashed) lines indicate the locations of transverse and sagittal histological sections in histology at the bottom right. Top right: NRASWT-driven brain tumors arise equally in the indicated compartments of the zebrafish brain. Averages correspond to two independent experiments, both of which gave rise to values of 50%. Forebrain or midbrain (gray bar) is indicated by gray shading, and cerebellum or brain stem (white bar) is indicated by white shading in schematic. Bottom: tumors arising in the optic tectum or cerebellum were detected by directly visualizing mCherry and confirmed by histology on indicated sections (black arrows show location of tumors). See also Figure S1. |
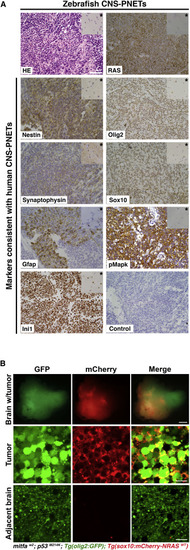
Zebrafish NRASWT-Driven Brain Tumors Derived from the Anterior Brain Closely Resemble Oligoneural CNS-PNET Tumors (A) Shown is a representative example of the histology (H&E [HE]) and IHC analysis (indicated in each panel) from three independent zebrafish brain tumors arising in the anterior lobes of NRASWT-expressing fish. Inset in each top right corner (indicated by a star) shows staining in the adjacent normal brain area. Scale bars, 50 μm. (B) Top panels show a confocal image of a live stable transgenic [mitfaw2; p53M214K; Tg(olig2:GFP)] zebrafish brain with an optic tectum tumor expressing Tg(sox10:mCherry-NRASWT). Middle panels show that the tumor is composed of large undifferentiated cells expressing GFP in the cytoplasm and mCherry at the membrane. Bottom panels show typical elongated oligodendrocytes in the adjacent tumor-free area. Scale bars, 500 μm (brain with tumor) and 10 μm (tumor and adjacent brain). |
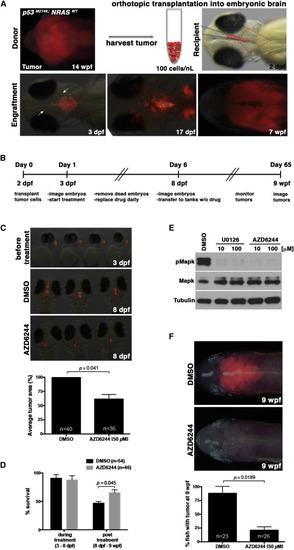
Drug Screens Using an Embryonic Brain Tumor Transplantation Assay Identify MEK as a Therapeutic Target for Oligoneural/NB-FOXR2 CNS-PNET-like Tumors (A) Tumors derived from the anterior brain of mitfaw2; p53M214K; Tg(sox10:mCherry-NRASWT) transgenic fish were harvested and injected into the fourth ventricle (outlined in red) of a 2-dpf mitfw2 embryo (top panels). The following day (3 dpf), successful injections were visualized by immunofluorescence, and some tumor cells could be found in the surrounding brain (arrows). By 17 dpf, tumor cells had proliferated and invaded the surrounding tissue. At 7 wpf, the tumor cells had spread throughout the brain. (B) Schematic describing the timeline for the orthotopic embryonic transplantation method and drug treatment. (C) Representative images of mCherry expression in embryos at 24 hr post-transplantation before treatment (3 dpf) and embryos treated daily for 5 days (8 dpf) with DMSO or MEK inhibitor AZD6244. Quantification of immunofluorescence on the final day of treatment (8 dpf) shows a significant decrease in the transplanted tumor mass in AZD6244-treated embryos compared to control. (D) Survival analysis of embryos during drug treatment (3–8 dpf) shows that DMSO and AZD6244 do not cause significant toxicity at doses used, while survival analysis from 8 dpf to 9 wpf shows that AZD6244-treated embryos have significantly higher post-treatment survival (p = 0.045). Averages in (C) and (D) represent three independent experiments (±SEM) for each panel. (E) Western blot showing that MEK inhibitors U0126 and AZD6244 inhibit Mapk signaling in zebrafish NRASWT-driven brain tumor cells treated ex vivo. (For U0126 treatment results, see Figure S3). (F) Representative images of the majority of 9-wpf adult fish at 8 weeks post-treatment (top) and quantification (bottom) from three independent experiments. Error bars represent ±SEM. See also Figure S3 and Movies S1 and S2. PHENOTYPE:
|
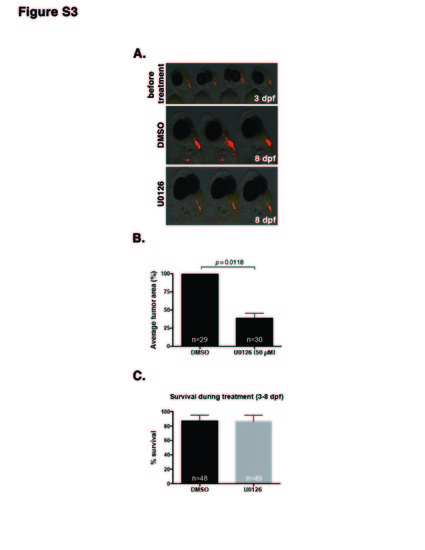
MEK inhibitors prevent growth of tumors in an embryonic transplantation assay. Related to Figure 4. (A) Representative images of embryos at 24 hours post transplantation before treatment (3 dpf) and embryos that have been treated for five days (8 dpf) with DMSO control or 50 μM MEK inhibitor U0126. (B) Quantification of immunofluorescence on the final day of treatment (8 dpf) shows a significant decrease in the transplanted tumor mass in U0126-treated embryos compared to control. (C) Analysis of embryo survival during treatment (3-8 dpf) with DMSO and U0126 shows that both treatments are well tolerated during this stage of development. Averages in (B-C) represent two independent experiments (+/-SEM). |