
Fig. 4
- ID
- ZDB-FIG-161122-35
- Publication
- Modzelewska et al., 2016 - MEK Inhibitors Reverse Growth of Embryonal Brain Tumors Derived from Oligoneural Precursor Cells
- Other Figures
- All Figure Page
- Back to All Figure Page
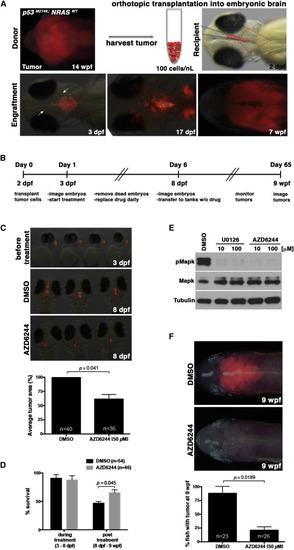
Drug Screens Using an Embryonic Brain Tumor Transplantation Assay Identify MEK as a Therapeutic Target for Oligoneural/NB-FOXR2 CNS-PNET-like Tumors (A) Tumors derived from the anterior brain of mitfaw2; p53M214K; Tg(sox10:mCherry-NRASWT) transgenic fish were harvested and injected into the fourth ventricle (outlined in red) of a 2-dpf mitfw2 embryo (top panels). The following day (3 dpf), successful injections were visualized by immunofluorescence, and some tumor cells could be found in the surrounding brain (arrows). By 17 dpf, tumor cells had proliferated and invaded the surrounding tissue. At 7 wpf, the tumor cells had spread throughout the brain. (B) Schematic describing the timeline for the orthotopic embryonic transplantation method and drug treatment. (C) Representative images of mCherry expression in embryos at 24 hr post-transplantation before treatment (3 dpf) and embryos treated daily for 5 days (8 dpf) with DMSO or MEK inhibitor AZD6244. Quantification of immunofluorescence on the final day of treatment (8 dpf) shows a significant decrease in the transplanted tumor mass in AZD6244-treated embryos compared to control. (D) Survival analysis of embryos during drug treatment (3–8 dpf) shows that DMSO and AZD6244 do not cause significant toxicity at doses used, while survival analysis from 8 dpf to 9 wpf shows that AZD6244-treated embryos have significantly higher post-treatment survival (p = 0.045). Averages in (C) and (D) represent three independent experiments (±SEM) for each panel. (E) Western blot showing that MEK inhibitors U0126 and AZD6244 inhibit Mapk signaling in zebrafish NRASWT-driven brain tumor cells treated ex vivo. (For U0126 treatment results, see Figure S3). (F) Representative images of the majority of 9-wpf adult fish at 8 weeks post-treatment (top) and quantification (bottom) from three independent experiments. Error bars represent ±SEM. See also Figure S3 and Movies S1 and S2. |
| Fish: | |
|---|---|
| Conditions: | |
| Observed In: | |
| Stage Range: | Protruding-mouth to Days 45-89 |