
Fig. 1
- ID
- ZDB-FIG-161122-33
- Publication
- Modzelewska et al., 2016 - MEK Inhibitors Reverse Growth of Embryonal Brain Tumors Derived from Oligoneural Precursor Cells
- Other Figures
- All Figure Page
- Back to All Figure Page
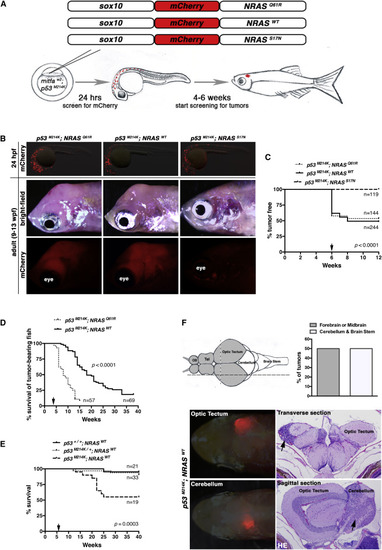
Oncogenic and WT NRAS Drive CNS Tumors in Zebrafish (A) Schematic of DNA constructs injected into one-cell-stage mitfaw2; p53M214K embryos and timeline for injections and screening of tumors arising from mosaic expression of the sox10:mCherry-NRAS constructs in (B)–(F). (B) Top panels show detection of chimeric expression of sox10:mCherry-NRAS constructs by immunofluorescence in lateral views of 24-hpf embryos to confirm injection efficiency. Only embryos that expressed mCherry at 24 hpf were raised for tumor and survival analysis in (C)–(E), but not all mCherry-expressing 24-hpf embryos would eventually develop tumors. Middle (bright-field) and bottom (mCherry) panels show a tumor mass arising in the head in NRASQ61R- and NRASWT-expressing fish but not NRASS17N-expressing fish. (C) Percentage of mitfaw2; p53M214K embryos injected with one of the indicated constructs that went on to develop tumors after 6 weeks (arrow). (D) Survival of tumor-bearing mitfaw2; p53M214K animals injected with indicated constructs analyzed after 4 weeks post-injection (arrow). (E) p53 dependence of NRASWT-driven tumors. The Tg(sox10:mCherry-NRASWT) construct was injected into embryos derived from an incross between mitfaw2; p53M214K/+ fish and analyzed for survival. Representative results from three independent injections are shown in (C)–(E). (F) Top left: schematic of zebrafish brain with forebrain and midbrain regions shaded gray, while cerebellum and brain stem are white. Olfactory bulb (OB) and telencephalon (Tel) are indicated. Vertical (stippled) and horizontal (dashed) lines indicate the locations of transverse and sagittal histological sections in histology at the bottom right. Top right: NRASWT-driven brain tumors arise equally in the indicated compartments of the zebrafish brain. Averages correspond to two independent experiments, both of which gave rise to values of 50%. Forebrain or midbrain (gray bar) is indicated by gray shading, and cerebellum or brain stem (white bar) is indicated by white shading in schematic. Bottom: tumors arising in the optic tectum or cerebellum were detected by directly visualizing mCherry and confirmed by histology on indicated sections (black arrows show location of tumors). See also Figure S1. |