
- Title
-
Progressive loss of RacGAP1/ogre activity has sequential effects on cytokinesis and zebrafish development
- Authors
- Warga, R.M., Wicklund, A., Richards, S.E., Kane, D.A.
- Source
- Full text @ Dev. Biol.
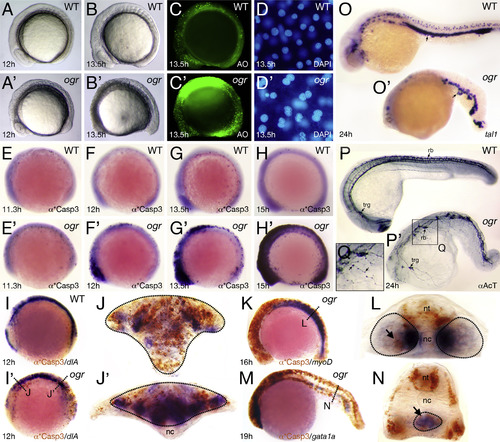
The ogre mutant phenotype. (A and B) Live embryos; (C) after acridine orange staining to show cell death; and (D) after DAPI-squash to show nuclei. (E-H) anti-Active Caspase 3 staining showing progression of apoptosis; and with dlA expression (I) marking neural tissue in the brain and spinal cord, with myoD expression (K) marking somite muscle in the trunk, and with gata1a expression (M) marking blood in the posterior blood island. (J, L, N) Are high magnification cross-sections through the areas indicated with lines and tissues are circled while arrows indicate apoptotic cells; abbreviations: nt, neural tissue; nc, notochord. (O-Q) Expression of: (O) tal1 mRNA marking blood cells (arrows) and (P) Acetylated Tubulin marking trigeminal (trg) and Rohon-Beard sensory (rb) neurons (arrows). (Q) High magnification of mutant axons, showing abnormal varicosities (arrows). EXPRESSION / LABELING:
|
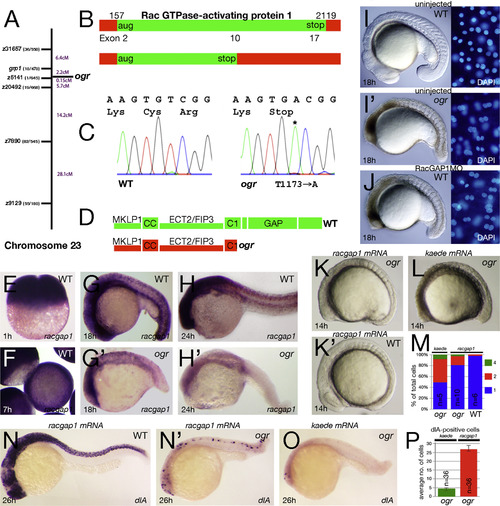
ogre is a mutation in racgap1. (A) Genetic map of chromosome 23 showing number of recombinants and calculated distance for microsatellite markers and genes. (B) Schematic of the racgap1 cDNA showing location of termination codon in exon 10 and (C) sequence trace data. (D) Schematic of the RacGAP1 protein. MKLP1 binding region; CC, coiled-coiled domain; ECT2/FIP3 binding region; C1, atypical C1 domain; GAP, GTPase-activating domain. (E-H) Expression of racgap1 mRNA: (E) maternal expression at 1 h; and (F-H) zygotic expression at: (F) 7 h; (G) 18 h; and (H) 24 h. (I-J) Anti-sense knockdown of racgap1 mRNA by morpholino (MO) phenocopies ogre; left side: embryo, right side: DAPI-stained nuclei. (K-P) racgap1 mRNA rescues the ogre mutant phenotype. (K) racgap1 injected and (L) kaede control embryos. (M) Quantification of multinucleate cells at 10-somites. Differences between kaede and racgap1 injected mutant embryos are significantly different (p<0.01, Wilcoxon rank sum); racgap1 injected wild type and mutant embryos are also significantly different (p<0.01, Wilcoxon rank sum). (N-P) dlA expression in neuroblasts: (N) racgap1 injected and (O) kaede control embryos and (P) their average number in ogre mutants. PHENOTYPE:
|
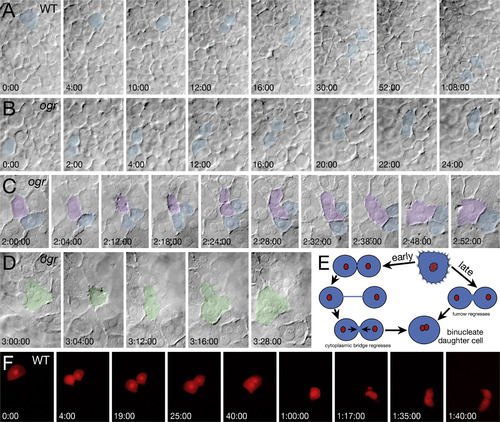
ogre mutants have both maternal and zygotic cytokinesis defects. (A-D) DIC bright field recordings of the zygotic cytokinesis defect. Panels are selected frames from two simultaneously recorded video time-lapses. (A) Wild type and (B) mutant sibling at the onset of gastrulation (6 h), initially mononucleate cells (blue) round up, divide and separate before fusing back together in the mutant. (C) Mid gastrulation (8 h), mutant cells attempting to divide round up and exhibit tiny projections over their cell surface, some cells (violet) fail to complete furrow ingression whereas other cells (blue) do. (D) Late gastrulation (9 h), binucleate mutant cells (green) also exhibit projections as they round up only no cleavage furrow forms. (E) Schematic of cytokinesis defects. Early gastrulation, daughter cells separate, but fuse back together. Late gastrulation, the furrow regresses and cells fuse back together. (F) Fluorescent recording of the transient maternal cytokinesis defect. At onset of epiboly (4.3 h), an enveloping layer cell (labeled with lineage tracer) in a phenotypic wild-type embryo completes furrow ingression before fusing back together. An hour later the binucleate cell rounds up and exhibits violent protrusive activity before it successfully divides into two characteristic enveloping layer cells. PHENOTYPE:
|
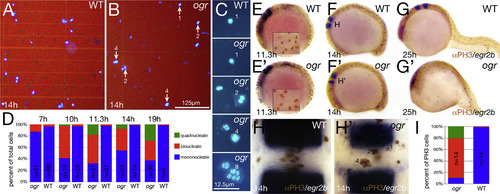
Mitosis continues after cytokinesis fails. (A-D) Dissociated cells. (A, B) Low magnification and (C) high magnification showing range of nuclear phenotypes. (D) Quantification of multinucleate cells. At 7 h, the proportion of cells with double nuclei ranked embryos; mutant embryos were then inferred by the simple Mendelian segregation of embryos with the highest deviation from wild type patterns. At 10 and 11.3 h, mutant embryos were inferred based on cell counts deviating from the wild type proportions. At 14 and 19 h, mutant embryos were identified morphologically before cell dissociations. The results of all of the embryos along with a partial statistical analysis are in Supplemental Fig. 2. (E-I) Multinucleate cells are mitotically active. (E-H) Phospho-Histone H3 staining and egr2b expression to visualize rhombomere 4, (E-G) are side views, insets in (E) are higher magnification of mitotic nuclei and (H) high magnification dorsal view of rhombomere 4. (I) Quantification of mitotic multinucleate cells at 10-somites in rhombomere 4; n indicates the number of embryos scored. Data are significantly different at the p<<0.001 level (contingency table tested with Pearson′s chi square). |
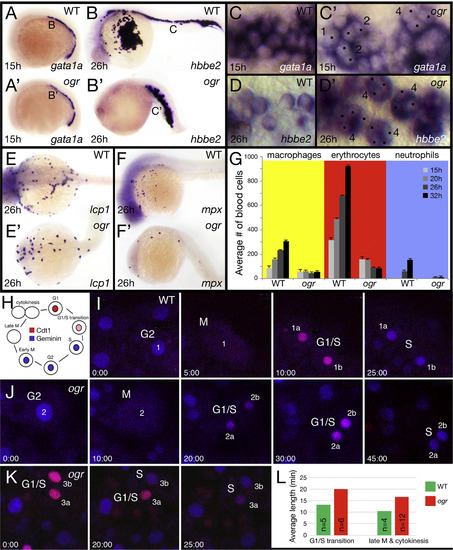
The cell cycle is longer in ogre. (A, B) Expression of: (A) gata1a and (B) hbbe2 in erythrocytes. (C, D) High magnification view of erythrocytes at 15 h (C) and at 26 h (D); numbers beside cells indicate their number of nuclei (dotted), not all nuclei are visible in the plane of focus, (E, F) Expression of: (E) lcp1 in macrophages and (F) mpx in neutrophils. (G) The average number of blood cells at different times of development. For erythrocytes we used gata1a expression at 15 and 20 h and hbbe2 expression at 26 and 32 h, for macrophages we used lcp1 expression and for neutrophils we used mpx expression, which comes up later. We examined 5 wild type and 5 mutant embryos per stage. (H) Schematic of the dual Fluorescence Ubiquitin Cell Cycle Indicator (FUCCI) with respect to the cell cycle. (I-K) Selected frames from three confocal time-lapses used to quantitate how long cells spent in late M and cytokinesis (when there is no signal) and the G1/S transition (when nuclei are pink). For each nucleus and its daughter nuclei, the stage of the cell cycle is indicated. Embryos (I) and (J) are siblings and were recorded simultaneously. Note that in mutant (J) cells take not only longer to transition through mitosis and G1/S, but that the Cdt1 degron takes longer than the Geminin degron to build expression in the G1/S transition. Note also that in mutant (K) the two daughter nuclei do not cycle together. (L) Quantification of G1/S transition and mitosis; n indicates the number of cells and in all but one case only one cell was used per embryo. Respectively, differences are significant at p<0.005 and p<0.002 (Wilcoxon Rank Sum). EXPRESSION / LABELING:
PHENOTYPE:
|
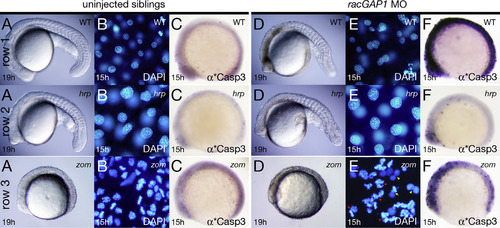
RacGAP1 depleted cells survive if cytokinesis is prevented. Row (1) phenotypic wild type, row (2) homozygous hrp mutants, and row (3) homozygous zom mutants. Row 1 and 2 are siblings. Column (A-C) uninjected embryos; column (D-F) morpholino (MO) knockdown embryos. (A, D) Live embryos, (B, E) DAPI stained nuclei: red arrowheads indicate sister nuclei where both nuclei are arrested in prophase; red arrow indicates two sister nuclei where one nuclei is in prophase and the other nuclei is in metaphase; yellow arrowheads indicate sister nuclei where both nuclei are in interphase; and yellow arrow indicates two sister nuclei where one nuclei is in interphase and the other nuclei is in prophase, and (C, F) anti-active Caspase 3 stained embryos. PHENOTYPE:
|
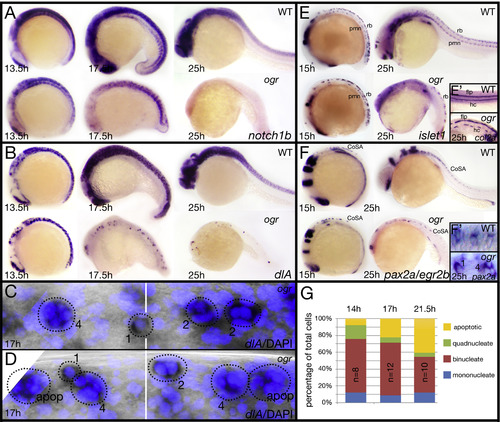
The ogre nervous system lacks later born neurons. (A, B) Expression of: (A) notch1b in proliferating cells and (B) dlA in neuroblasts. (C, D) High magnification view of neuroblasts visualized with dlA and DAPI. Numbers beside circled dlA-positive cells indicate their number of nuclei or if the cell was apoptotic (apop), white bar shows the boundary between somites 3 and 4. (E) Expression of islet1 in primary motoneurons (pmn) and Rohon-Beard sensory neurons (rb). Inset (E′) expression of col2a in floorplate neurons (flp) and hypochord cells (hc). (F) Expression of: pax2a and egr2b in CoSA interneurons (CoSA) and inset (F′) high magnification of CoSA interneurons. Numbers beside cells indicate their number of nuclei. (G) Quantification of multinucleate neuroblasts between somites 2 and 8; n indicates the number of embryos at different stages. Differences are significant compared between 14 h and 17 h (p<0.001) and compared between 17 h and 21.5 h (p<0.05; contingency tables/Pearson′s chi square). EXPRESSION / LABELING:
PHENOTYPE:
|
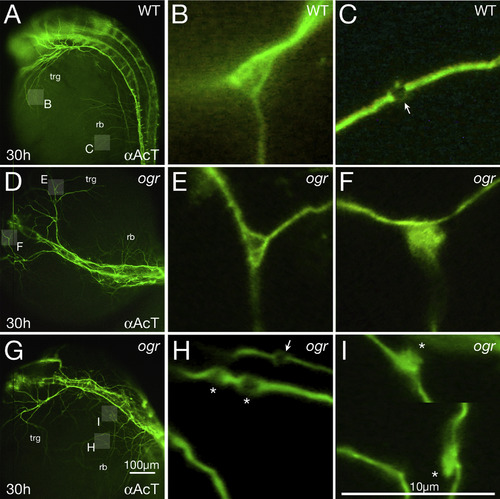
Microtubules are disorganized in mutant axons. (A-I) 30 h embryos visualized with anti-Acetylated Tubulin. (A, D, G) Low magnification, showing pathfinding errors in trigeminal (trg) and Rohon-Beard (rb) peripheral axons; highlighted boxes indicate regions shown at higher magnification in panels (B, C, E, F, H, I). (B, C) Wild type: (B) a branch point where individual microtubules defasciculate and fan out and (C) a presumptive presynaptic swelling (arrow) where individual microtubules form a loop. (E, F) ogre: (E) a normal looking branch point and (F) a branch point where microtubules tangle. (H, I) ogre: (H) three presumptive presynaptic swellings where one looks normal (arrow) and two not normal (indicated with asterisk) due to them being immediately adjacent to each other and appearing swollen (the one on the left may also be instead a region where individual microtubules abnormally defasciculate from one another and tangle), and (I) two presumptive presynaptic swellings along the same neurite (the picture is cropped to show both) where instead of forming loops the microtubules form large irregular tangles (asterisks). Note how in general mutant presumptive presynaptic swellings are larger than wild type. |
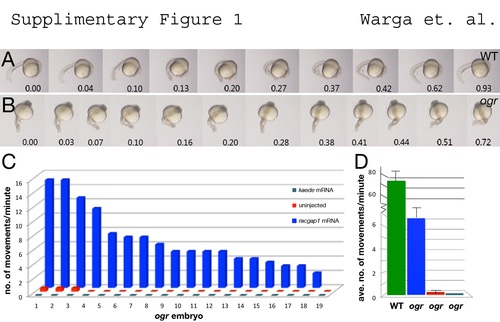
racgap1 mRNA rescues motor function in ogre. (A, B) Twitching movement of sibling embryos injected with wild-type racgap1 mRNA. (C, D) Quantification of movement (number of twitches) per minute: (C) individual embryos and (D) the average. |
Reprinted from Developmental Biology, 418(2), Warga, R.M., Wicklund, A., Richards, S.E., Kane, D.A., Progressive loss of RacGAP1/ogre activity has sequential effects on cytokinesis and zebrafish development, 307-22, Copyright (2016) with permission from Elsevier. Full text @ Dev. Biol.