
|
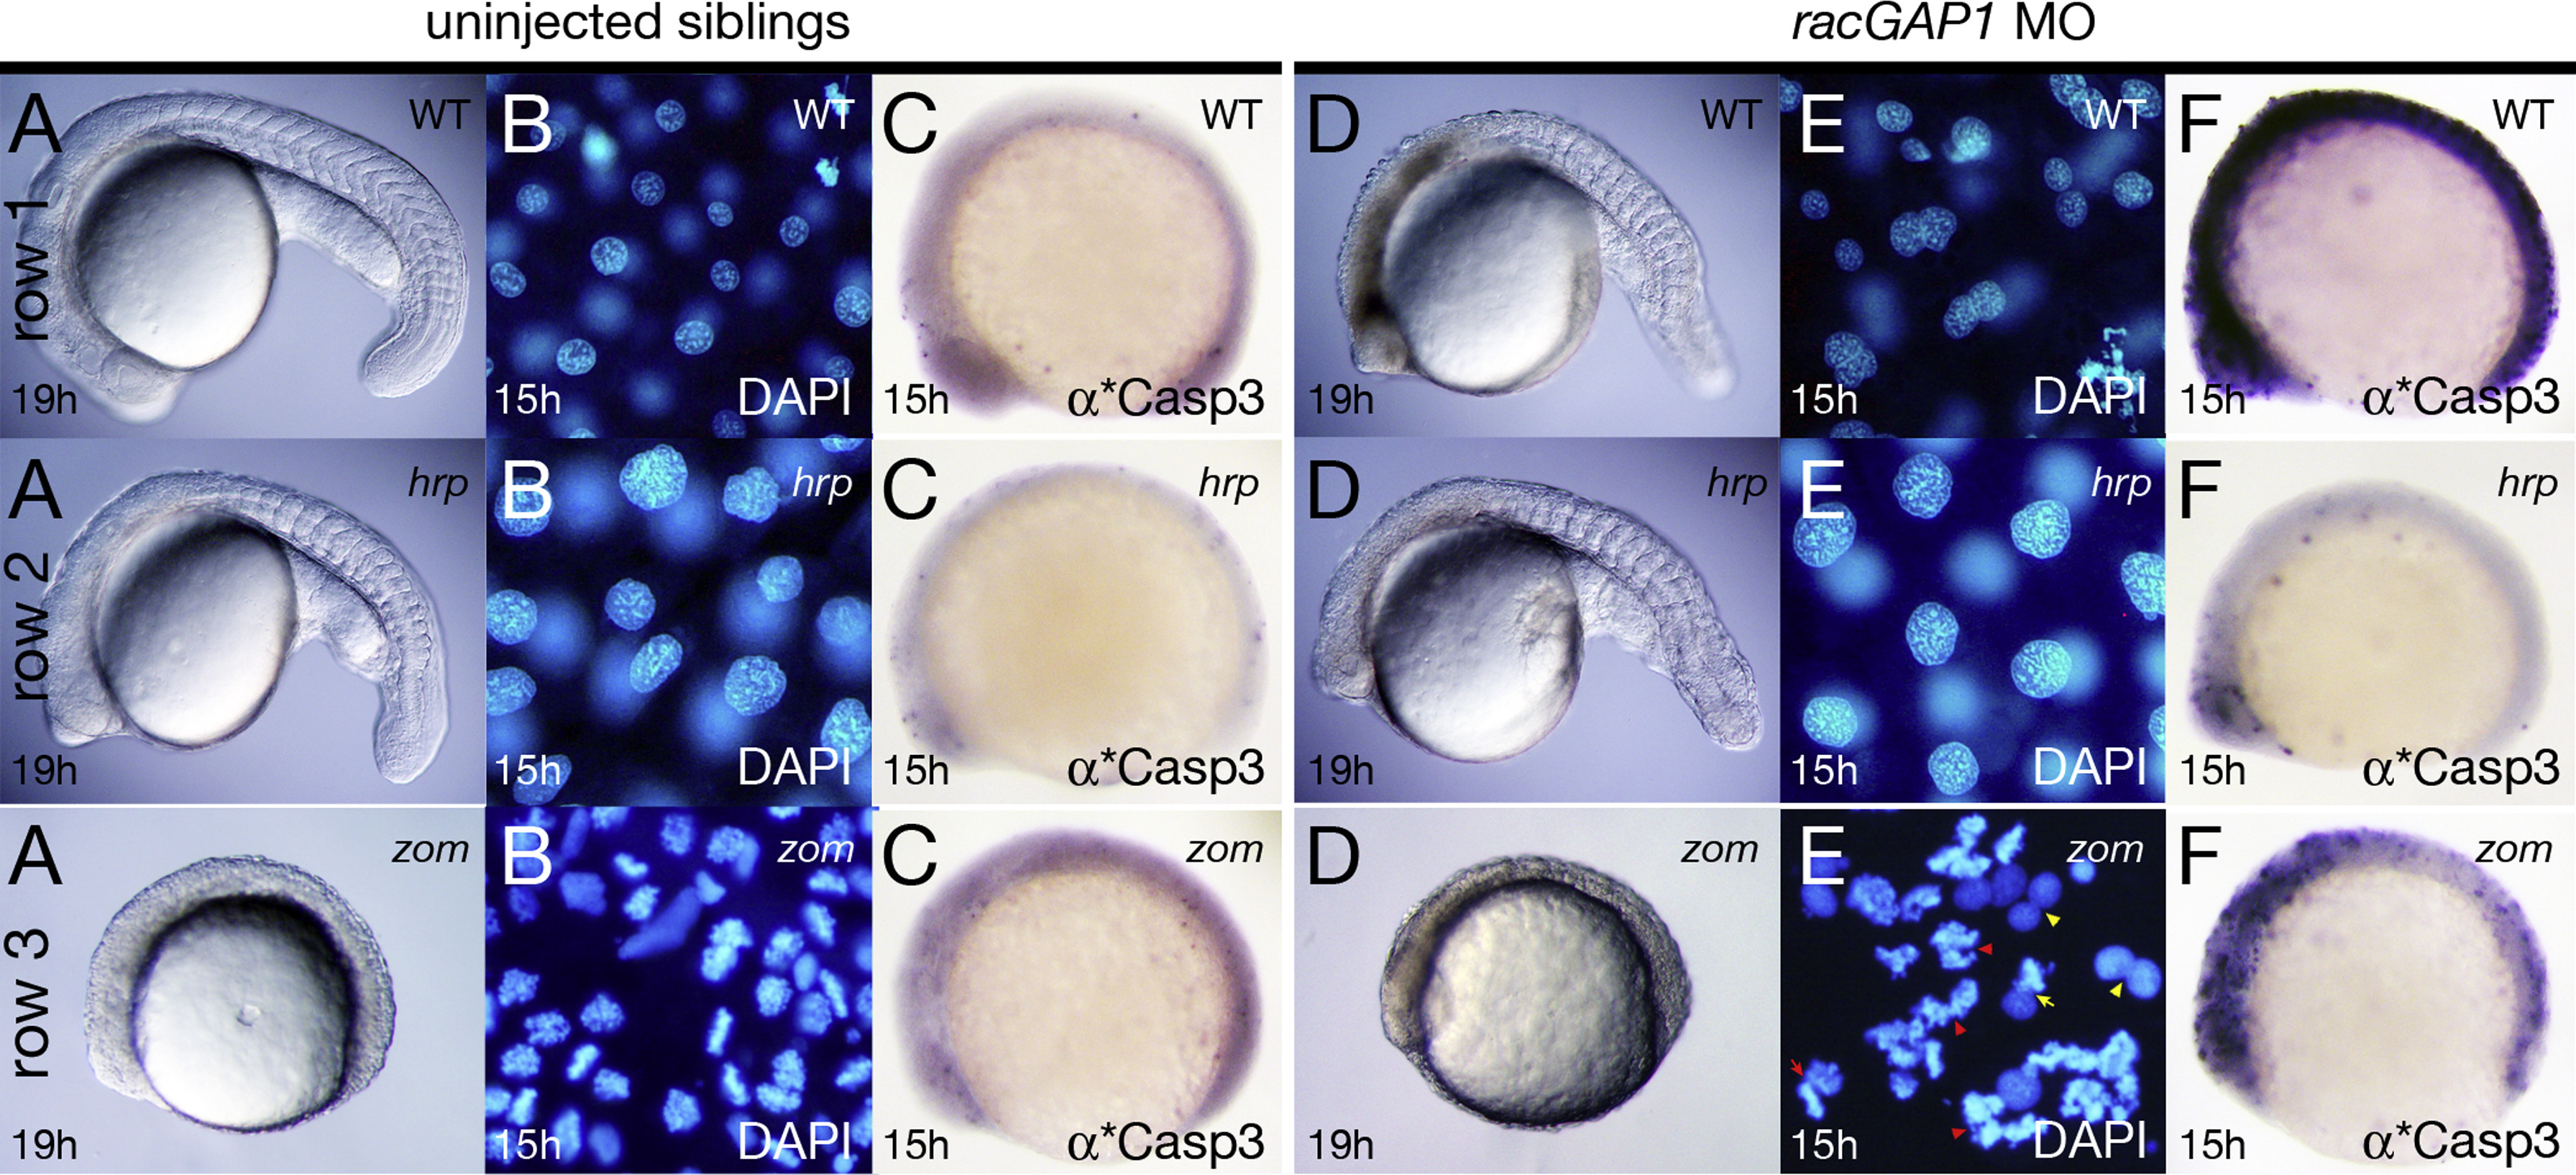
Fig. 6
RacGAP1 depleted cells survive if cytokinesis is prevented. Row (1) phenotypic wild type, row (2) homozygous hrp mutants, and row (3) homozygous zom mutants. Row 1 and 2 are siblings. Column (A-C) uninjected embryos; column (D-F) morpholino (MO) knockdown embryos. (A, D) Live embryos, (B, E) DAPI stained nuclei: red arrowheads indicate sister nuclei where both nuclei are arrested in prophase; red arrow indicates two sister nuclei where one nuclei is in prophase and the other nuclei is in metaphase; yellow arrowheads indicate sister nuclei where both nuclei are in interphase; and yellow arrow indicates two sister nuclei where one nuclei is in interphase and the other nuclei is in prophase, and (C, F) anti-active Caspase 3 stained embryos.
Reprinted from Developmental Biology, 418(2), Warga, R.M., Wicklund, A., Richards, S.E., Kane, D.A., Progressive loss of RacGAP1/ogre activity has sequential effects on cytokinesis and zebrafish development, 307-22, Copyright (2016) with permission from Elsevier. Full text @ Dev. Biol.