
Fig. 5
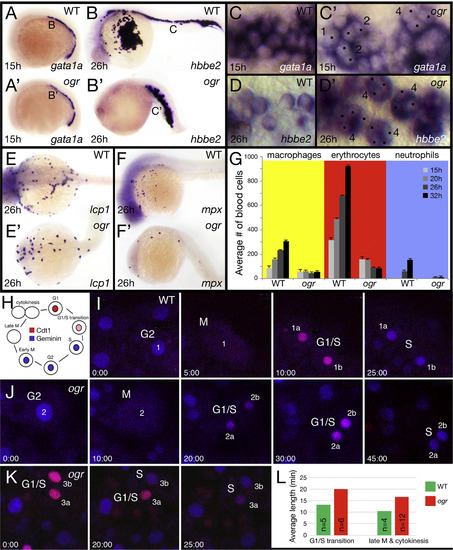
The cell cycle is longer in ogre. (A, B) Expression of: (A) gata1a and (B) hbbe2 in erythrocytes. (C, D) High magnification view of erythrocytes at 15 h (C) and at 26 h (D); numbers beside cells indicate their number of nuclei (dotted), not all nuclei are visible in the plane of focus, (E, F) Expression of: (E) lcp1 in macrophages and (F) mpx in neutrophils. (G) The average number of blood cells at different times of development. For erythrocytes we used gata1a expression at 15 and 20 h and hbbe2 expression at 26 and 32 h, for macrophages we used lcp1 expression and for neutrophils we used mpx expression, which comes up later. We examined 5 wild type and 5 mutant embryos per stage. (H) Schematic of the dual Fluorescence Ubiquitin Cell Cycle Indicator (FUCCI) with respect to the cell cycle. (I-K) Selected frames from three confocal time-lapses used to quantitate how long cells spent in late M and cytokinesis (when there is no signal) and the G1/S transition (when nuclei are pink). For each nucleus and its daughter nuclei, the stage of the cell cycle is indicated. Embryos (I) and (J) are siblings and were recorded simultaneously. Note that in mutant (J) cells take not only longer to transition through mitosis and G1/S, but that the Cdt1 degron takes longer than the Geminin degron to build expression in the G1/S transition. Note also that in mutant (K) the two daughter nuclei do not cycle together. (L) Quantification of G1/S transition and mitosis; n indicates the number of cells and in all but one case only one cell was used per embryo. Respectively, differences are significant at p<0.005 and p<0.002 (Wilcoxon Rank Sum). |
| Genes: | |
|---|---|
| Fish: | |
| Anatomical Terms: | |
| Stage Range: | 10-13 somites to Prim-5 |
| Fish: | |
|---|---|
| Observed In: | |
| Stage: | Prim-5 |
Reprinted from Developmental Biology, 418(2), Warga, R.M., Wicklund, A., Richards, S.E., Kane, D.A., Progressive loss of RacGAP1/ogre activity has sequential effects on cytokinesis and zebrafish development, 307-22, Copyright (2016) with permission from Elsevier. Full text @ Dev. Biol.