
- Title
-
A transcription factor network controls cell migration and fate decisions in the developing zebrafish pineal complex
- Authors
- Khuansuwan, S., Clanton, J.A., Dean, B.J., Patton, J.G., Gamse, J.T.
- Source
- Full text @ Development
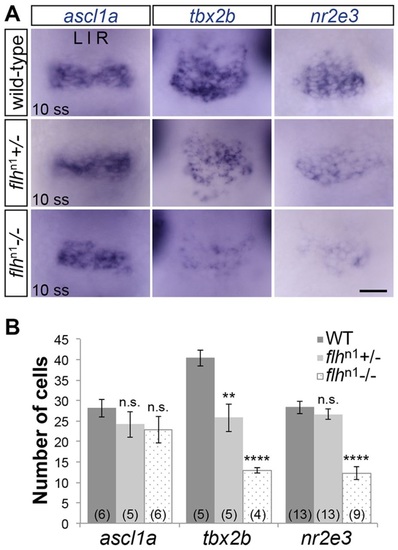
Decreased expression of tbx2b and nr2e3 in Flh mutants. (A) In situ hybridization showing dorsal views of ascl1a, tbx2b and nr2e3 expression in the pineal anlage of WT, flhn1+/- or flhn1-/- embryos at 10 ss (14hpf). Scale bar: 30µm. (B) Quantification of the number of cells expressing ascl1a, tbx2b or nr2e3 at 10 ss under the indicated genetic backgrounds; mean±s.e.m. and number of samples (n) are shown. ****P<0.0001, **P<0.01, P>0.05 (n.s.), one-way ANOVA with Dunnett′s post-hoc analysis. EXPRESSION / LABELING:
PHENOTYPE:
|
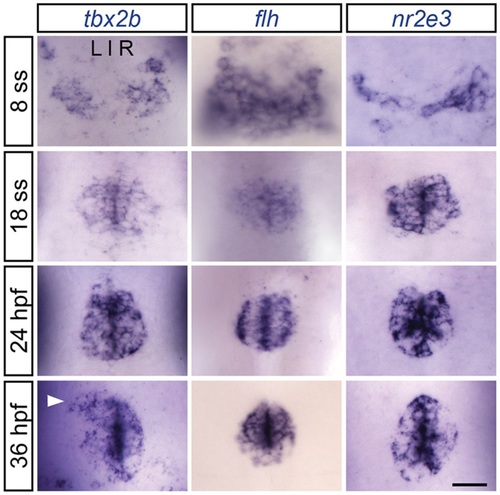
tbx2b, flh and nr2e3 are expressed early during parapineal development. Dorsal views of in situ hybridizations of tbx2b, flh and nr2e3 in the pineal complex at the indicated stages. At 8 ss (13hpf), the pineal anlage is in the process of fusing at the midline. Parapineal specification occurs around 15-18hpf. By 24hpf, tbx2b-expressing parapineal precursors begin to coalesce at the anterior-most region of the pineal anlage. By 36hpf, a group of parapineal neurons can be observed as a distinct tbx2b-positive, flh/nr2e3-negative population that has migrated away from the pineal organ (arrowhead). Scale bar: 30µm. EXPRESSION / LABELING:
|
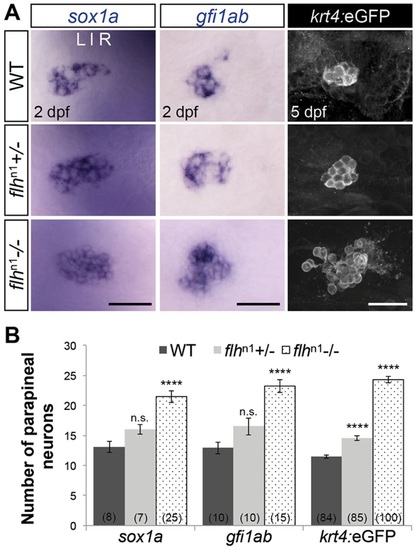
Flh inhibits specification of parapineal neurons in a dosage-dependent manner. (A) Dorsal views of in situ hybridizations of sox1a and gfi1ab and antibody labeling of krt4:eGFP in the epithalamus under the indicated genetic backgrounds and stages. Scale bars: 30µm. (B) Quantification of the number of cells expressing different markers of parapineal neurons; mean±s.e.m. and number of samples (n) are shown. ****P<0.0001, P>0.05 (n.s.), one-way ANOVA with Dunnett′s post-hoc analysis. |
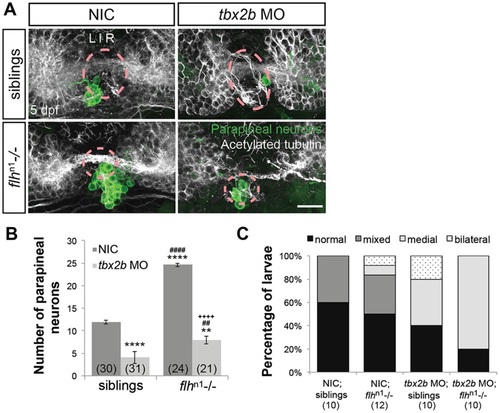
Flh acts in parallel with Tbx2b to specify parapineal fate, but does not govern migration. (A) Dorsal views of antibody labeling of parapineal neurons (krt4:eGFP+) as well as axons and dendrites (acetylated tubulin+) in the epithalamus at 5dpf. The pineal organ regions are marked by dashed circles. Scale bar: 30µm. (B) Quantification of the number of parapineal neurons in siblings (WT and flhn1+/-) or flhn1-/- mutants that were either non-injected (NIC) or injected with tbx2b morpholinos; mean±s.e.m. and number of samples (n) are shown. Loss of Tbx2b function suppresses the flhn1-/- supernumerary parapineal specification phenotype, as well as migration of parapineal neurons. ****P<0.0001, **P<0.01, P>0.05 (n.s.), one-way ANOVA with Tukey′s post-hoc analysis, comparisons with NIC;siblings (*), comparisons with tbx2b MO;siblings (#), and a comparison with flhn1-/- (+) are shown. (C) Quantification showing the percentages of larvae that display normal, bilateral, mixed (some neurons migrate and others do not), or medial (all neurons remain near the midline) parapineal-migration phenotypes and number of samples (n). |
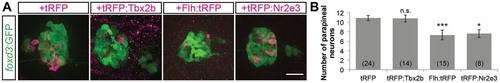
Mosaic overexpression of Tbx2b does not induce additional parapineal neurons; mosaic overexpression of Flh or Nr2e3 suppresses the number of parapineal neurons. (A) Representative images of 2dpf antibody-labeled pineal complexes (foxd3:GFP+) with the indicated protein mosaically overexpressed. Scale bar: 30µm. (B) Quantification of the number of parapineal neurons in Tg[foxd3:GFP] zf10; Tg[cfos:gal4vp16]s1145t double transgenic embryos injected with pDestTol2CG2(4nrUAS:tagRFP-T:polyA) (tRFP), pDestTol2CG2(4nrUAS:tagRFP-T:tbx2b) (tRFP:Tbx2b), pDestTol2CG2(4nrUAS:flh:tagRFP-T) (Flh:tRFP), or pDestTol2CG2(4nrUAS:tagRFP-T:nr2e3) (tRFP:Nr2e3); mean±s.e.m. and number of samples (n) are shown. ***P <0.001, *P<0.05, P>0.05 (n.s.), one-way ANOVA with Dunnett′s post-hoc analysis, comparisons with tRFP shown. |
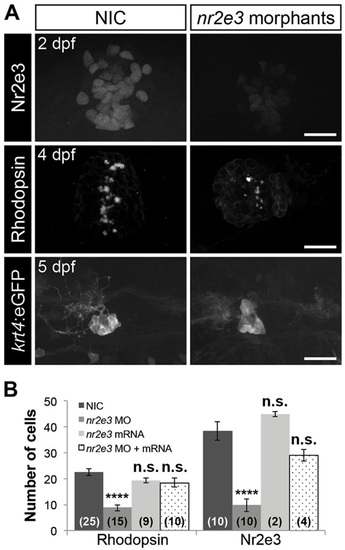
Nr2e3 inhibits specification of parapineal neurons and is necessary for pineal rod photoreceptors specification. (A) Representative images of antibody labeling of Nr2e3, Rhodopsin and krt4:eGFP in the pineal complexes of non-injected controls (NIC) and nr2e3 splice morphants at the indicated stages. Dorsal views. Scale bars: 30µm. (B) Quantification of the number of Rhodopsin- or Nr2e3-positive cells at 2dpf in NICs, nr2e3 splice morphants, nr2e3 mRNA-injected or nr2e3 morphants/nr2e3 mRNA-injected embryos; mean±s.e.m. and number of samples (n) are shown. ****P<0.0001, P>0.05 (n.s.), one-way ANOVA with Dunnett′s post-hoc analysis. |
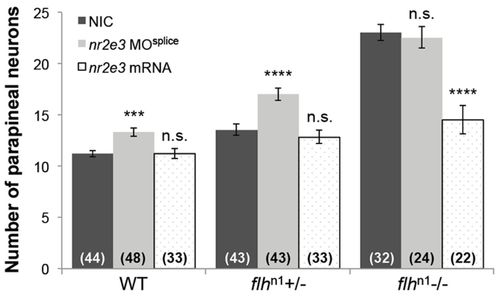
Flh inhibits parapineal neuron specification through Nr2e3. Quantification of the number of krt4:eGFP-positive cells (parapineal neurons) in WT, flhn1+/-, and flhn1-/- larvae that were either non-injected (NIC), injected with nr2e3 splice morpholinos (nr2e3 MOsplice) or injected with nr2e3 mRNA; mean±s.e.m. and number of samples (n) are shown. ****P<0.0001, ***P<0.001, P>0.05 (n.s.), one-way ANOVA with Dunnett′s post-hoc analysis. PHENOTYPE:
|
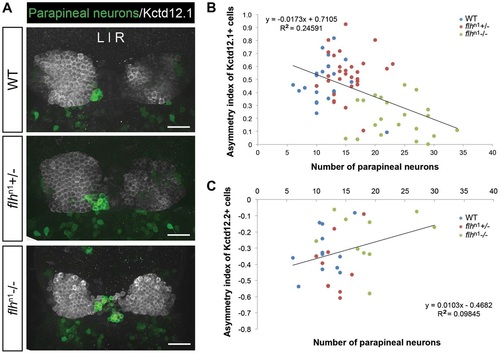
Decreased habenular asymmetry is observed in Flh-deficient larvae. (A) Representative images of antibody labeling of krt4:eGFP (parapineal neurons) and Kctd12.1 protein (lateral habenular neurons) in the zebrafish epithalamus at 5dpf. Dorsal views. Scale bars: 30µm. (B,C) Asymmetry indices of Kctd12.1- (n=74; B) and Kctd12.2- (n=32; C) positive neurons in Flh-deficient larvae plotted against the numbers of parapineal neurons. The habenulae of larvae with the greatest reduction of Flh (flhn1-/-), and thus the largest number of parapineal neurons, were more symmetrical compared with their siblings. Pearson′s correlation tests were used to determine R2 values. |
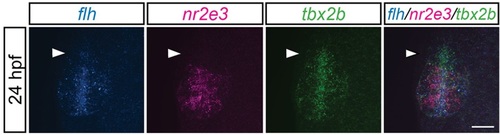
The anterior-most region of the pineal anlage during parapineal development is mostly tbx2b-positive, nr2e3- and flh-negative. tbx2b expression is expanded in the anterior-most region of pineal anlage (arrowheads) relative to flh or nr2e3 expression patterns. Dorsal views of triple fluorescence DNA hybridization chain reaction in situ amplification of flh, nr2e3 and tbx2b at 24hpf. Scale bar: 30µm. EXPRESSION / LABELING:
|
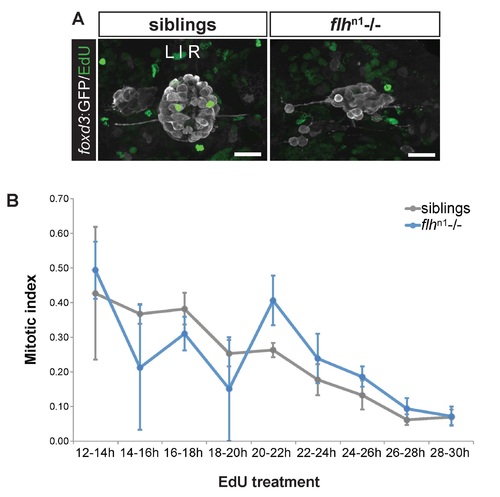
Similar proportions of pineal complex cells undergo mitosis between flhn1 mutants and their siblings. (A) Representative images of EdU expression in the pineal complex (foxd3:GFP) between flhn1 mutants and their siblings at 2 dpf treated with EdU between 24-26 hpf. Scale bars: 30 µm. (B) Mitotic indices in flhn1 mutants and their siblings treated with EdU at the indicated times (mean ± s.e.m.). No significant difference was observed between flhn1 mutants and their siblings at any time (P>0.05), two-tailed t-test. Number of samples examined for siblings, flhn1 mutants: 2, 5 (12-14h); 4, 2 (14-16h); 8, 9 (16-18h); 2, 2 (18-20h); 7, 7 (20-22h); 6, 3 (22-24h); 6, 10 (24-26h); 7, 10 (26-28h); 11, 9 (28-30h). |
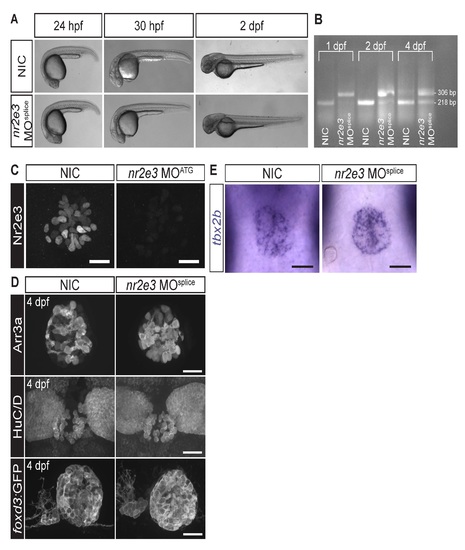
Splice site- and translation initiation-blocking morpholinos significantly decreased Nr2e3 protein levels but caused no overall morphological defects. (A) Representative images of non-injected controls (NICs) and nr2e3 splice morphants at the indicated stages. (B) Semi-quantitative RT-PCR demonstrates a band shift consistent with retention of the intron 2 of nr2e3 (88 bp in length), which is predicted to lead to a premature stop codon. (C) Representative images of antibody labeling of Nr2e3 of the pineal complex at 1 dpf in NICs and nr2e3 ATG morphants. Average fluorescence is 263,923 ± 36,837 arbitrary units in NICs (a.u., n=8) and 8,750 ± 4,063 a.u. in nr2e3 ATG morphants (n=7); P = 2.27 x 10⁻⁵; two-tailed t-test. (D) Representative images of antibody labeled pineal complexes of NICs and nr2e3 splice site- morphants at 4 dpf. Quantification of all cell types in nr2e3 MOsplice can be found in Table 2. (E) Representative images of in situ hybridization of tbx2b in NICs and nr2e3 splice morphants at 24 hpf. Dorsal views. Scale bars: 30 µm. |
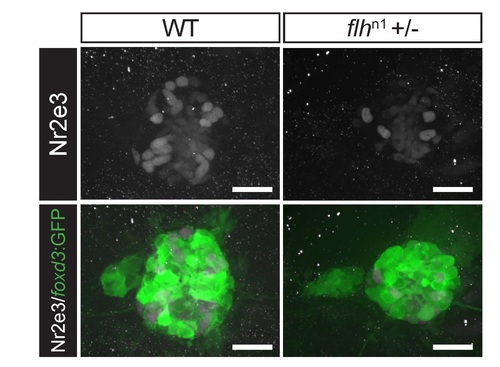
Reduction of Nr2e3 protein levels in embryos with reduced Flh function. Representative images of antibody labeled pineal complexes (foxd3:GFP+) demonstrating that Nr2e3 protein level is reduced in flh+/- as compared to WT at 2 dpf. Average fluorescence of Nr2e3 expressing cells in WT is 316,055 ± 105,863 a.u., (n=6) and 182,581 ± 41,091 a.u. in flh+/- (n=6). P = 0.016, two-tailed t-test. Scale bars: 30 µm. |
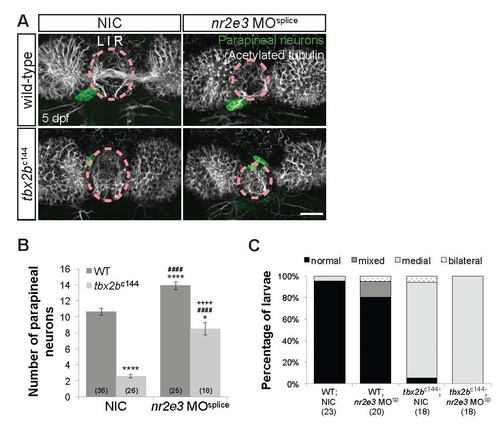
Tbx2b acts in parallel with Nr2e3 during parapineal specification. (A) Dorsal views of antibody labeling of parapineal neurons (krt4:eGFP+) as well as axons and dendrites (acetylated tubulin+) in the epithalamus at 5 dpf. Parapineal neurons in tbx2bc144 or tbx2bc144/nr2e3 morphants do not migrate correctly and remain within the pineal organ region (dashed circles). Scale bar: 30 µm. Loss of Nr2e3 function partially suppressed the tbx2bc144 parapineal specification phenotype, but did not suppress the migration defect phenotype (B,C). (B) Quantification of the number of parapineal neurons in non-injected controls (NICs) or nr2e3 splice morphants that either have both WT copies of tbx2b (WT) or two mutated copies (tbx2bc144-/-); mean±s.e.m. and number of samples (n) are shown. ****p<0.0001, *p<0.05, one-way ANOVA with Tukey’s post hoc analysis, comparisons with WT;NIC (*), comparisons with tbx2bc144;NIC (#), and a comparison with nr2e3 MOsplice (+) are shown. (C) Quantification of the percentages of larvae that have normal, bilateral, mixed (some cells migrate and others do not), or medial (cells remain near the midline) migration phenotypes and number of samples (n) are shown. Parapineal migration phenotypes were determined based on the position of parapineal neurons relative to acetylated tubulin as well as the projection direction of parapineal neurons. When two parapineal organs were observed, parapineal migration phenotypes were assessed for each parapineal organ and classified as mixed (when only one of two parapineal organs migrated correctly) or bilateral (when one of the parapineal organs migrate to the left and the other to the right of the pineal organ). Loss of Tbx2b function leads to an increased percentage of larvae with parapineal migration defects. |
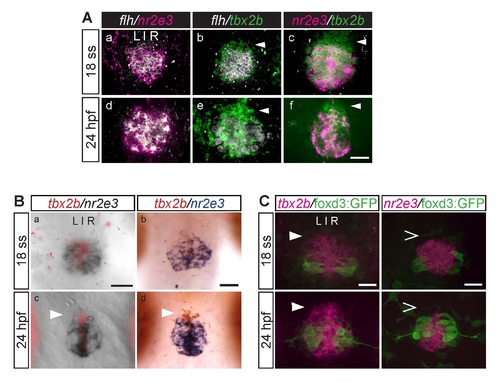
During parapineal development, the anterior-most region of the pineal anlage is mostly tbx2b-positive, nr2e3- and flh-negative (arrowheads). This difference is subtle at the 18 ss (18 hpf) but becomes more apparent at 24 hpf. (A) Dorsal views of the pineal anlage of double fluorescence in situ hybridizations of flh/nr2e3, flh/tbx2b, and nr2e3/tbx2b embryos at 18 ss (a-c) and 24 hpf (d-f). nr2e3 and flh expression appear to mostly overlap (a, d). (B) Double in situ hybridizations of tbx2b and nr2e3 in the pineal anlage at the indicated stages. (a,c) tbx2b was developed using Fast Red reagents and imaged under fluorescence; nr2e3 was developed using NBT/BCIP and imaged under bright field. (b,d) tbx2b (developed using INT/BCIP) and nr2e3 (developed using NBT/BCIP) were imaged under bright field. (C) Double labeling with fluorescence in situ hybridization (tbx2b or nr2e3) and antibody labeling of foxd3:GFP positive cells (used as landmarks) in the pineal anlage. At these stages, foxd3:GFP is only expressed in projection neurons. Scale bars: 30 µm. |