
Fig. S2
- ID
- ZDB-FIG-160819-10
- Publication
- Khuansuwan et al., 2016 - A transcription factor network controls cell migration and fate decisions in the developing zebrafish pineal complex
- Other Figures
- All Figure Page
- Back to All Figure Page
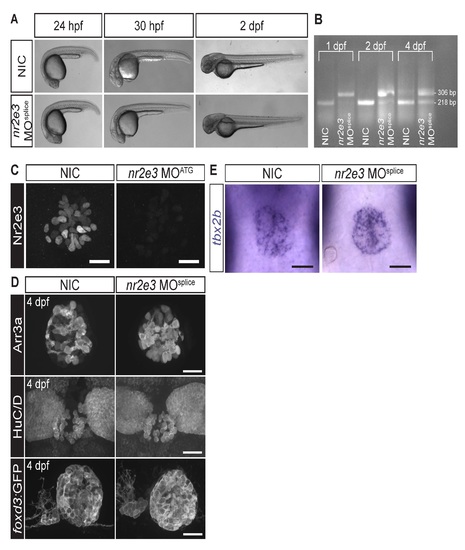
Splice site- and translation initiation-blocking morpholinos significantly decreased Nr2e3 protein levels but caused no overall morphological defects. (A) Representative images of non-injected controls (NICs) and nr2e3 splice morphants at the indicated stages. (B) Semi-quantitative RT-PCR demonstrates a band shift consistent with retention of the intron 2 of nr2e3 (88 bp in length), which is predicted to lead to a premature stop codon. (C) Representative images of antibody labeling of Nr2e3 of the pineal complex at 1 dpf in NICs and nr2e3 ATG morphants. Average fluorescence is 263,923 ± 36,837 arbitrary units in NICs (a.u., n=8) and 8,750 ± 4,063 a.u. in nr2e3 ATG morphants (n=7); P = 2.27 x 10⁻⁵; two-tailed t-test. (D) Representative images of antibody labeled pineal complexes of NICs and nr2e3 splice site- morphants at 4 dpf. Quantification of all cell types in nr2e3 MOsplice can be found in Table 2. (E) Representative images of in situ hybridization of tbx2b in NICs and nr2e3 splice morphants at 24 hpf. Dorsal views. Scale bars: 30 µm. |