
|
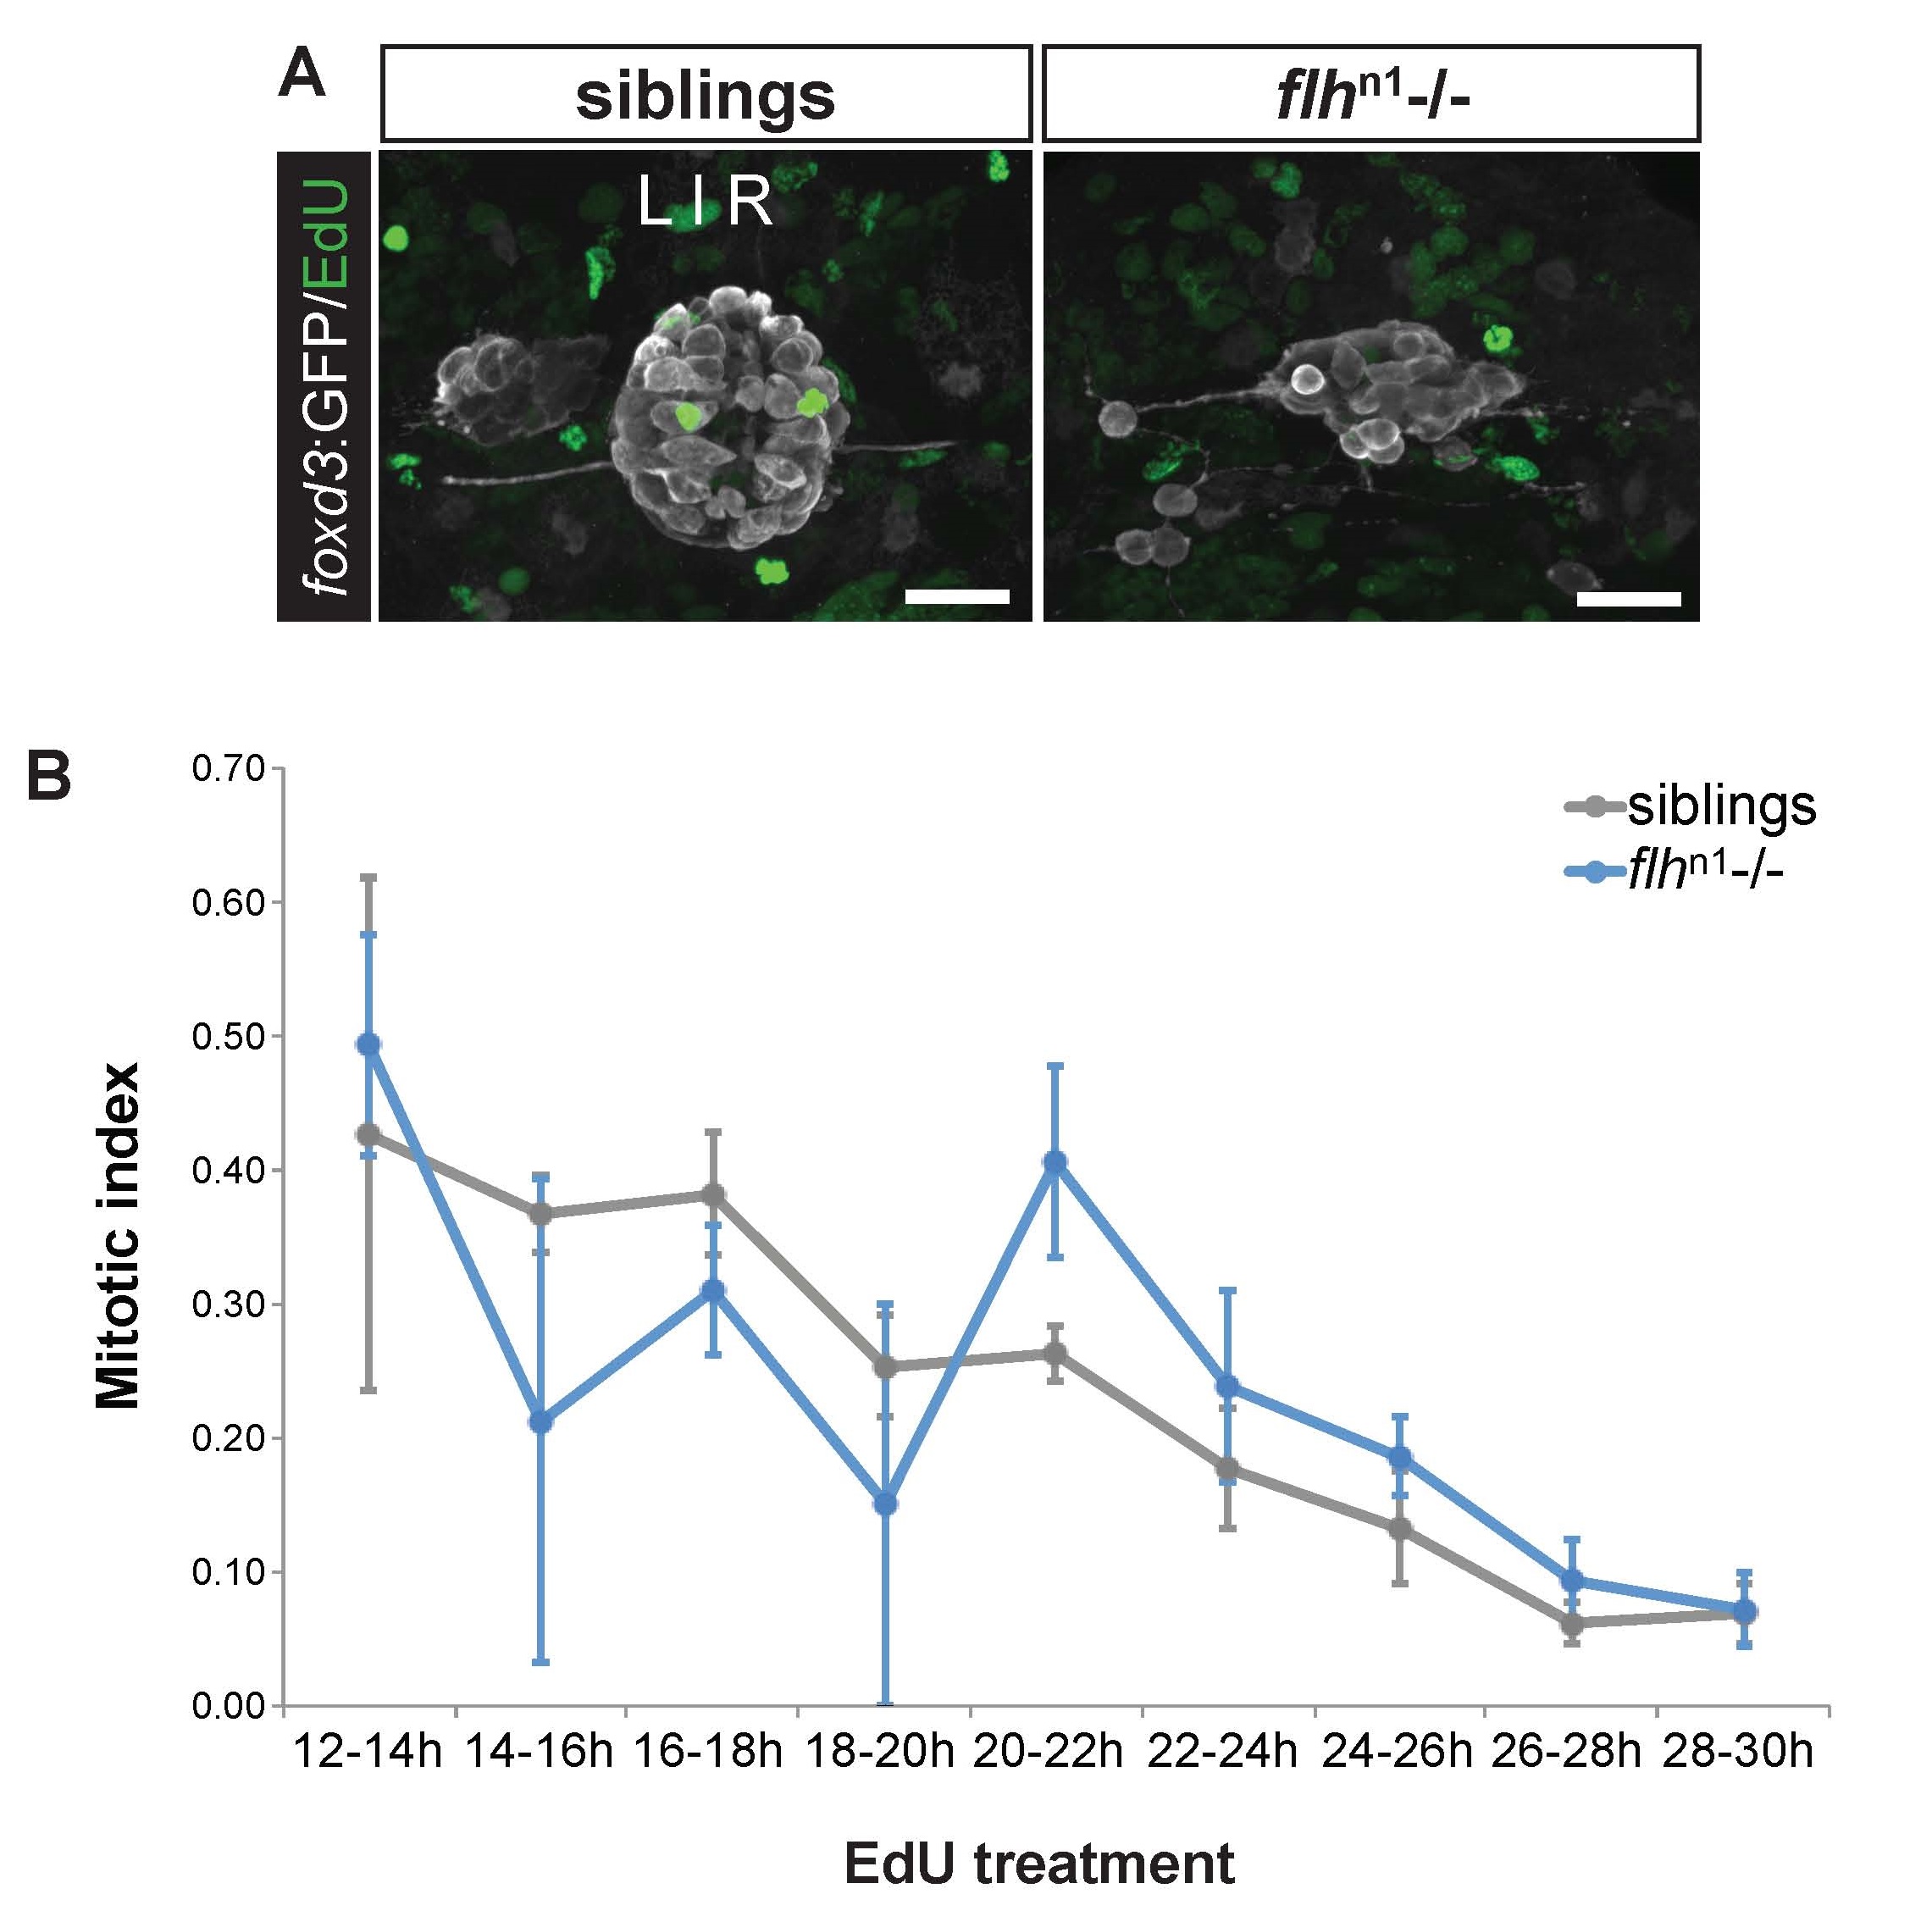
Fig. S1
Similar proportions of pineal complex cells undergo mitosis between flhn1 mutants and their siblings. (A) Representative images of EdU expression in the pineal complex (foxd3:GFP) between flhn1 mutants and their siblings at 2 dpf treated with EdU between 24-26 hpf. Scale bars: 30 µm. (B) Mitotic indices in flhn1 mutants and their siblings treated with EdU at the indicated times (mean ± s.e.m.). No significant difference was observed between flhn1 mutants and their siblings at any time (P>0.05), two-tailed t-test. Number of samples examined for siblings, flhn1 mutants: 2, 5 (12-14h); 4, 2 (14-16h); 8, 9 (16-18h); 2, 2 (18-20h); 7, 7 (20-22h); 6, 3 (22-24h); 6, 10 (24-26h); 7, 10 (26-28h); 11, 9 (28-30h).