
- Title
-
An essential role for Grk2 in Hedgehog signalling downstream of Smoothened
- Authors
- Zhao, Z., Lee, R.T., Pusapati, G.V., Iyu, A., Rohatgi, R., Ingham, P.W.
- Source
- Full text @ EMBO Rep.
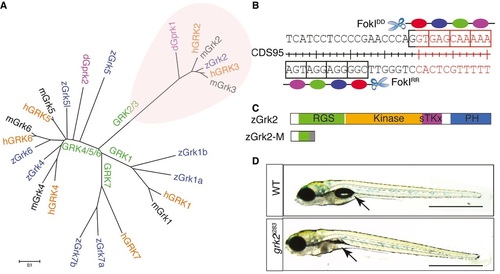
Generation of a zebrafish grk2 null mutation A. Phylogenic tree showing the relationship of the various vertebrate Grk genes and the Drosophila gprk gene. B. Schematic representation of the exon 1 nucleotide sequence of zebrafish grk2 gene targeted by the ZFN. C. Schematic representation of the zebrafish Grk2 protein domains and the truncated peptide predicted to be encoded by the grk2i283 mutant allele. D. Homozygous grk2i283 mutant at 4dpf compared to wild type (WT) sibling (N = 80). Arrows indicate the position of swim bladder. Scale bar, 1 mm. PHENOTYPE:
|
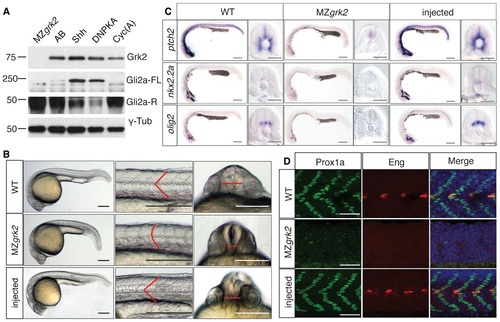
Loss of Grk2 impairs Hh signal transduction in zebrafish A. Western blot analysis of the different forms of Gli2a in MZgrk2 embryos compared to wildtype (AB), shh mRNA and dnPKA mRNAinjected wildtype and cyclopamine (Cyc(A))treated wildtype 20hpf embryos. Gli2aFL levels are low relative to Gli2aR levels in wildtype embryos, but are elevated in response to pathway activation (shh and dnPKA mRNA injected). Gli2aR levels are increased while Gli2aFL is undetectable in CycAtreated and MZgrk2 mutant embryos. Probing the same blot with rabbit antiGRK3 (which recognises the zebrafish Grk2 protein) reveals a complete loss of fulllength Grk2 in MZgrk2 embryos. Probing with anti-γ-tubulin was performed as a loading control. Three biological replicates of this analysis were performed. B. Phenotype of wildtype (WT), MZgrk2 and grk2GFP mRNAinjected MZgrk2 embryos at 24hpf (n = 20 for each sample). The red lines indicate the shape of the somites (middle panels) and the separation of the eyes (right hand panels). Scale bar, 200 µm. C. In situ hybridisation of ptch2, nkx2.2a and olig2 transcripts in wildtype, MZgrk2and grk2GFPinjected MZgrk2 24hpf embryos. Each panel shows a full view of the embryo on the left and a crosssectional view of a somite on the right (n = 30 for each sample). Scale bars, 200 µm (whole mounts), 50 µm (sections). D. Expression of Prox1a and Engrailed (Eng) proteins in somites of wildtype, MZgrk2 and grk2GFP mRNAinjected MZgrk2 embryos at 30hpf. Each panel shows Prox1a in green, Eng in red and the merged images with DAPI staining in blue (n = 10 for each sample). Scale bar, 50 µm. EXPRESSION / LABELING:
PHENOTYPE:
|
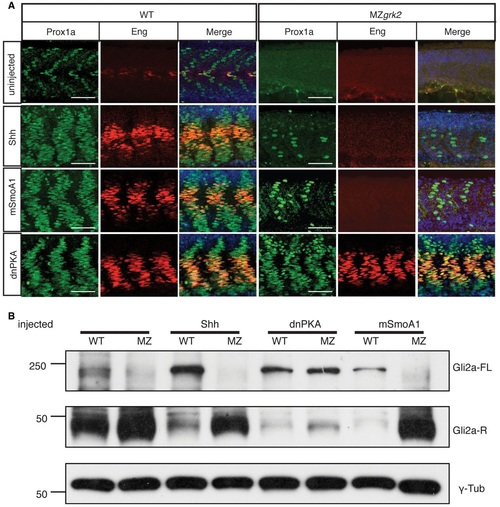
Grk2 acts upstream of Gli processing A. Prox1a and Eng expression in the myotome of 30hpf wildtype (WT) and MZgrk2 embryos injected with mRNAs encoding Shh, dnPKA or mSmoA1GFP. Each panel shows Prox1a in green, Eng in red and the merged images with DAPI staining in blue. The colabelling for Prox1a and Eng (orange) is indicative of MP differentiation (n = 30 for each sample). Scale bar, 50 µm. B. Western blot showing levels of Gli2aFL and Gli2aR forms in 20hpf wildtype (WT) and MZgrk2 (MZ) embryos injected with mRNA encoding Shh, dnPKA or mSmoA1GFP, respectively. γ-tubulin was used as a loading control. Three biological replicates of this analysis were performed. |
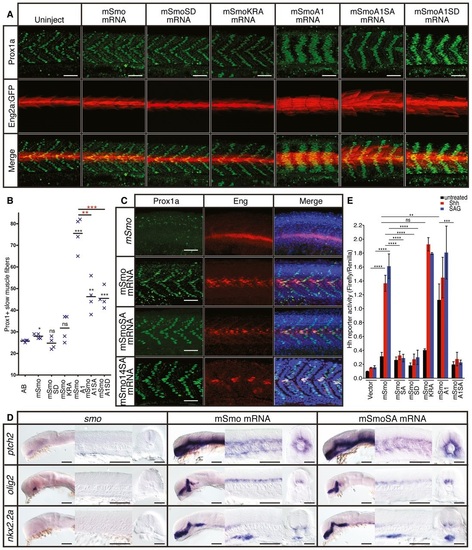
Phosphorylation of the CTT is not essential for Smo function A. Expression of Prox1a (green) and the eng2a:GFP reporter (red) in otherwise wildtype 30hpf embryos injected with mRNA encoding wildtype and mutant forms of mouse Smo (mSmo). Ectopic MPs are indicated by fibres colabelled with Proxa1 and GFP; ectopic MFFs are labelled only with GFP. Images are representative of embryos in the following proportions of each sample: 28/28 (mSmo; mSmoA1; mSmoSD; mSmoKRA); 9/28 (mSmoA1SA); and 12/28 (mSmoA1SD). Scale bar, 50 µm. B. Average number of Prox1a+ve slow fibres in wildtype embryos injected with mRNA encoding different forms of mSmo. Prox1positive cells were quantified in four somites in each of four embryos for each sample. The error bars indicate SD. Unpaired Student′s ttest was used to determine the statistical significance between uninjected embryos and the various Smo mutants (black asterisk) and between mSmoA1 and mSmoA1SA or mSmoA1SD (red asterisk). ***P < 0.001; **P < 0.01; *P < 0.05 and n.s. (not significant). C. Prox1a and Eng expression in smohi1640 mutant embryos injected with mRNA encoding mSmo (n = 10), mSmoSA (n = 9) and mSmo14SA (n = 6). Note the full recovery of SSFs and MPs compared to the uninjected controls. Scale bar, 50 µm. D. In situ hybridisation for transcripts of ptch2, olig2 and nkx2.2 in 24hpf smohi1640 mutant embryos injected with mRNA encoding mSmo and mSmoSA (n = 6 for each sample). Scale bars, 100 µm (lateral view), 50 µm (sections). E. Hh reporter assay of the activity of wildtype and mutant forms of mSmo in Smo/ MEFs in response to Shh or SAG stimulation. Note that mSmoA1 shows constitutive activity in the absence of either Shh or SAG, whereas mSmoKRA does not; all mutants affecting phosphorylation failed to restore the response to Shh or SAG. Data represent the mean and ± SD (n = 3). Unpaired Student′s ttest was used for analysis. ****P < 0.0001; ***P < 0.001; **P < 0.01; and n.s. (not significant). |
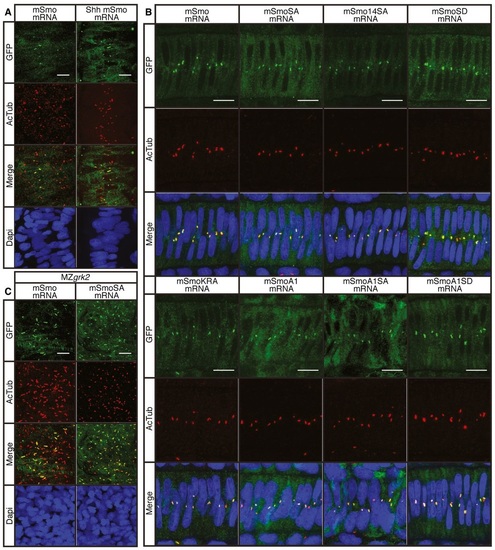
Cilia localisation of wildtype and mutant Smo A. Wildtype 18hpf embryos injected with mRNA encoding GFPtagged mSmo (green) showing localisation to the PC of myotomal cells labelled with antiacetylated tubulin (AcTub; red), stimulated in response to Shh injection (n = 4). Differences in PC distribution are due to morphological changes in the myotome induced by ectopic expression of Shh as revealed by the distribution of nuclei (DAPI stained; blue). Scale bar, 10 µm. B. Notochord cells of wildtype embryos expressing GFPtagged wildtype and mutant forms of mSmo. Note the localisation to the PC (labelled with antiAcTub; red) in each case (n = 4 for each sample). Scale bar, 10 µm. C. MZgrk2 18hpf embryos injected with mRNA encoding GFPtagged wildtype mSmo or mSmoSA (green) showing localisation to the PC (labelled with antiAcTub; red) in myotomal cells. More Smo is localised to the PC in MZgrk2 mutants compared to wild type (panel A). Scale bar, 10 µm. |
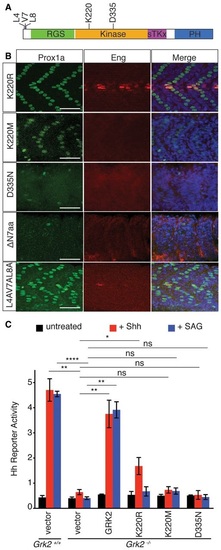
Domains of Grk2 required for Hh pathway activity A. Schematic representation of the zebrafish Grk2 protein showing the location of residues assayed for the effects of their mutation on rescuing activity. B. Prox1a (green) and Eng (red) expression in the myotome of 30hpf MZgrk2 embryos that were injected with mRNA encoding: Grk2K220RGFP; Grk2K220MGFP; Grk2D335NGFP; Grk2ΔN7aaGFP; and mGrk2L4AV7AL8AGFP. Merged panels show nuclear staining with DAPI in blue (n = 20 for each sample). Scale bar, 50 µm. C. Hh reporter activity assay in wildtype and Grk2-/- 3T3 cells transfected with the equivalent wildtype and mutant kinase domain forms of mouse Grk2, Grk2K220R, Grk2K220M and Grk2D335N after 24h ShhN and SAG treatment. Data represent the mean and ± SD (n = 3). Unpaired Student′s ttest was used for analysis. ****P < 0.0001; **P < 0.01; *P < 0.05; and n.s. (not significant). |
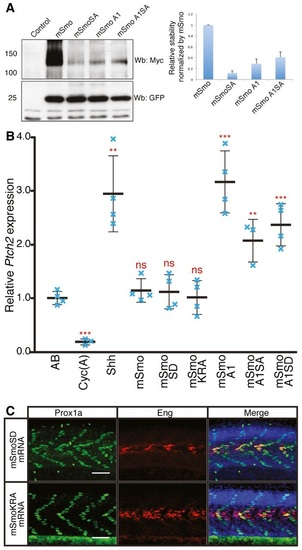
Phosphorylation and dimerisation of Smo does not impair or enhance Hh activity A. Western blot analysis of wildtype and mutant forms of Smo expressed from bicistronic myctagged mSmo and GFP constructs injected into wildtype zebrafish embryos. The histogram shows the quantification of Myctagged mSmo vs. GFP (n = 3). The error bars indicate SD. B. Normalised expression of ptch2 in 18hpf wildtype (AB), Cyc(A)treated embryos and embryos injected with mRNA encoding Shh or various Smo mutants. Individual data points (blue crosses) are shown; mean is indicated by thick solid line, and SD by thin bars. Unpaired Student′s ttest was used to determine the statistical significance between control (AB) and experimental embryos. ***P < 0.001; **P < 0.01; and n.s. (not significant). C. Prox1a and Eng expression in smohi1640 mutant embryos injected with mRNA encoding mSmoSD (n = 7) and mSmoKRA (n = 7). These mutant embryos show full recovery of SSFs and MPs. Embryos shown are at 30hpf. Scale bar, 50 µm. |
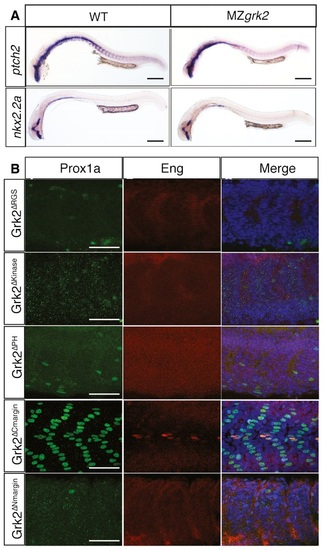
MZgrk2 is fully rescued by mRNA encoding Grk2K220R and Grk2 domain swapping assay A. In situ hybridisation of ptch2 and nkx2.2a in 24hpf wildtype (left column) and MZgrk2 embryos expressing Grk2K220RGFP (right column) (n = 30 for each sample). Scale bar, 200 µm. B. Prox1a (green) and Eng (red) expression in the myotome of 30hpf MZgrk2 embryos injected with mRNA encoding Grk2ΔRGSGFP, Grk2ΔkinaseGFP, Grk2ΔPHGFP, Grk2ΔCmarginGFP and Grk2ΔNmarginGFP. Merge images show nuclei labelled with DAPI (blue) (n = 20). Scale bar, 50 µm. |