
Fig. 2
|
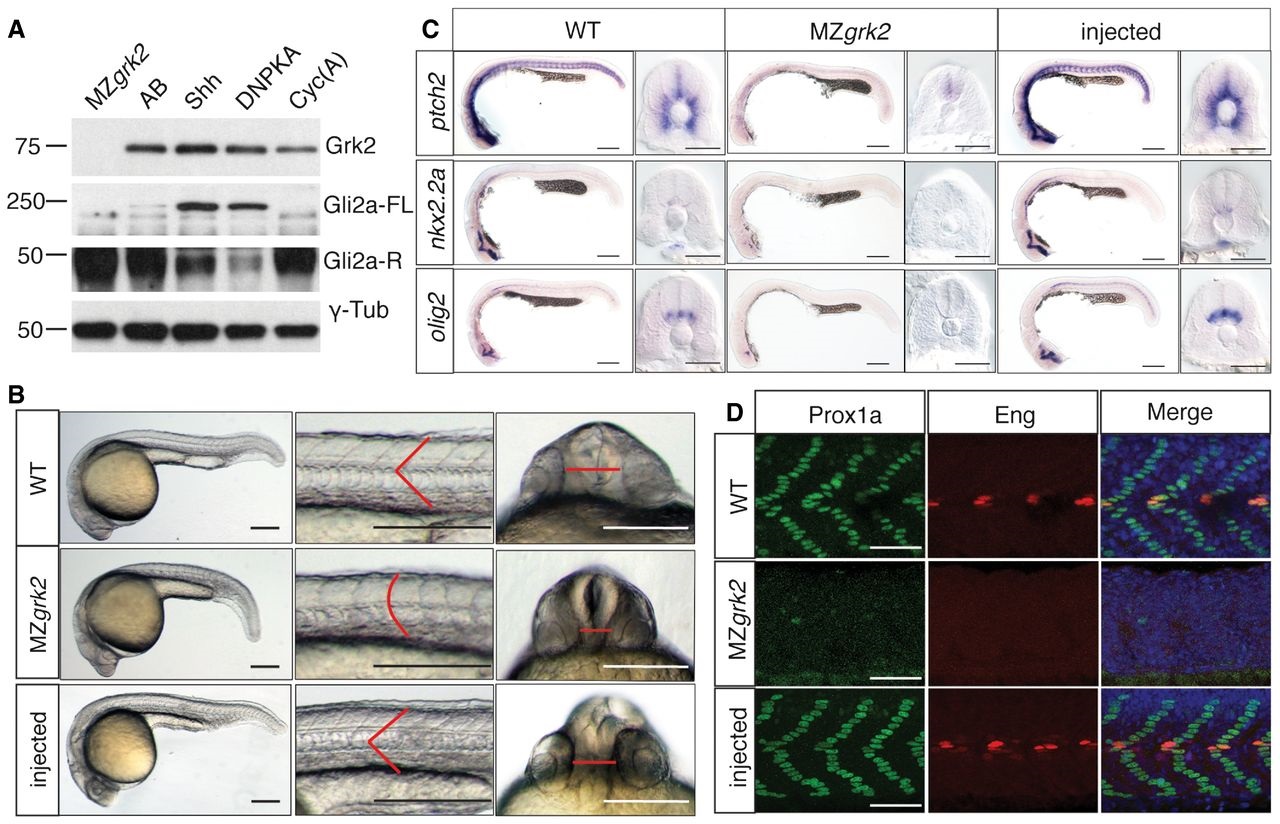
Fig. 2
Loss of Grk2 impairs Hh signal transduction in zebrafish
A. Western blot analysis of the different forms of Gli2a in MZgrk2 embryos compared to wildtype (AB), shh mRNA and dnPKA mRNAinjected wildtype and cyclopamine (Cyc(A))treated wildtype 20hpf embryos. Gli2aFL levels are low relative to Gli2aR levels in wildtype embryos, but are elevated in response to pathway activation (shh and dnPKA mRNA injected). Gli2aR levels are increased while Gli2aFL is undetectable in CycAtreated and MZgrk2 mutant embryos. Probing the same blot with rabbit antiGRK3 (which recognises the zebrafish Grk2 protein) reveals a complete loss of fulllength Grk2 in MZgrk2 embryos. Probing with anti-γ-tubulin was performed as a loading control. Three biological replicates of this analysis were performed.
B. Phenotype of wildtype (WT), MZgrk2 and grk2GFP mRNAinjected MZgrk2 embryos at 24hpf (n = 20 for each sample). The red lines indicate the shape of the somites (middle panels) and the separation of the eyes (right hand panels). Scale bar, 200 µm.
C. In situ hybridisation of ptch2, nkx2.2a and olig2 transcripts in wildtype, MZgrk2and grk2GFPinjected MZgrk2 24hpf embryos. Each panel shows a full view of the embryo on the left and a crosssectional view of a somite on the right (n = 30 for each sample). Scale bars, 200 µm (whole mounts), 50 µm (sections).
D. Expression of Prox1a and Engrailed (Eng) proteins in somites of wildtype, MZgrk2 and grk2GFP mRNAinjected MZgrk2 embryos at 30hpf. Each panel shows Prox1a in green, Eng in red and the merged images with DAPI staining in blue (n = 10 for each sample). Scale bar, 50 µm.