
Fig. 5
- ID
- ZDB-FIG-160525-28
- Publication
- Zhao et al., 2016 - An essential role for Grk2 in Hedgehog signalling downstream of Smoothened
- Other Figures
- All Figure Page
- Back to All Figure Page
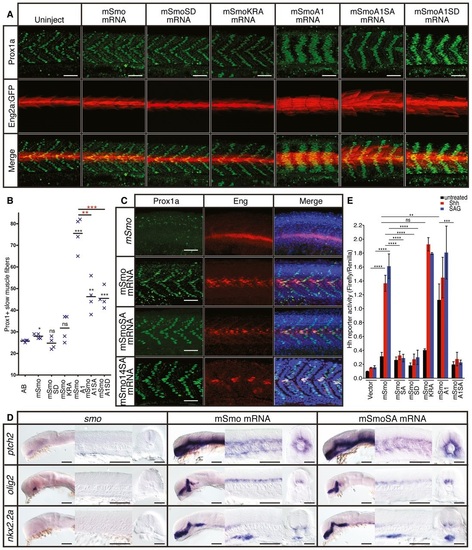
Phosphorylation of the CTT is not essential for Smo function A. Expression of Prox1a (green) and the eng2a:GFP reporter (red) in otherwise wildtype 30hpf embryos injected with mRNA encoding wildtype and mutant forms of mouse Smo (mSmo). Ectopic MPs are indicated by fibres colabelled with Proxa1 and GFP; ectopic MFFs are labelled only with GFP. Images are representative of embryos in the following proportions of each sample: 28/28 (mSmo; mSmoA1; mSmoSD; mSmoKRA); 9/28 (mSmoA1SA); and 12/28 (mSmoA1SD). Scale bar, 50 µm. B. Average number of Prox1a+ve slow fibres in wildtype embryos injected with mRNA encoding different forms of mSmo. Prox1positive cells were quantified in four somites in each of four embryos for each sample. The error bars indicate SD. Unpaired Student′s ttest was used to determine the statistical significance between uninjected embryos and the various Smo mutants (black asterisk) and between mSmoA1 and mSmoA1SA or mSmoA1SD (red asterisk). ***P < 0.001; **P < 0.01; *P < 0.05 and n.s. (not significant). C. Prox1a and Eng expression in smohi1640 mutant embryos injected with mRNA encoding mSmo (n = 10), mSmoSA (n = 9) and mSmo14SA (n = 6). Note the full recovery of SSFs and MPs compared to the uninjected controls. Scale bar, 50 µm. D. In situ hybridisation for transcripts of ptch2, olig2 and nkx2.2 in 24hpf smohi1640 mutant embryos injected with mRNA encoding mSmo and mSmoSA (n = 6 for each sample). Scale bars, 100 µm (lateral view), 50 µm (sections). E. Hh reporter assay of the activity of wildtype and mutant forms of mSmo in Smo/ MEFs in response to Shh or SAG stimulation. Note that mSmoA1 shows constitutive activity in the absence of either Shh or SAG, whereas mSmoKRA does not; all mutants affecting phosphorylation failed to restore the response to Shh or SAG. Data represent the mean and ± SD (n = 3). Unpaired Student′s ttest was used for analysis. ****P < 0.0001; ***P < 0.001; **P < 0.01; and n.s. (not significant). |
| Genes: | |
|---|---|
| Fish: | |
| Anatomical Term: | |
| Stage: | Prim-5 |
| Fish: | |
|---|---|
| Observed In: | |
| Stage: | Prim-5 |