
- Title
-
Paclitaxel-induced epithelial damage and ectopic MMP-13 expression promotes neurotoxicity in zebrafish
- Authors
- Lisse, T.S., Middleton, L.J., Pellegrini, A.D., Martin, P.B., Spaulding, E.L., Lopes, O., Brochu, E.A., Carter, E.V., Waldron, A., Rieger, S.
- Source
- Full text @ Proc. Natl. Acad. Sci. USA
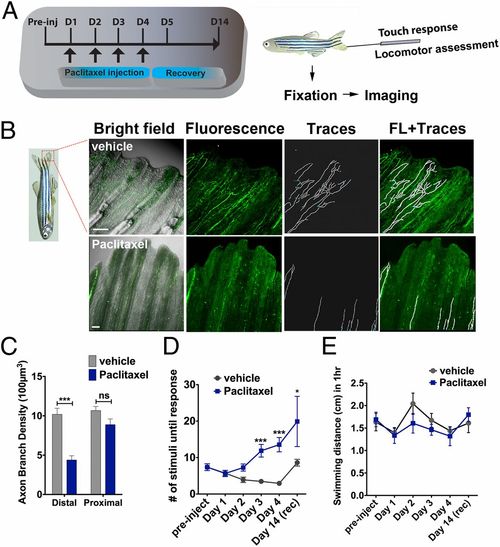
Paclitaxel induces sensory axon degeneration and loss of touch response in adult zebrafish. (A) Experimental design for induction and assessment of peripheral neuropathy in adult zebrafish by daily injections of 10 µM paclitaxel on 4 consecutive days, followed by 10 d of recovery. (B) Anti-acetylated tubulin staining of axons 1 d after the last injection. Fine cutaneous nerve endings are present in vehicle control (Top) but not in paclitaxel-treated (Bottom) fish. Vehicle axons were partially traced. (Scale bar, 100 µm.) (C) Selective nerve fiber loss in distal but not proximal caudal fin (n = 7, 5-6 fish per group). (D) Touch response assessed before each daily injection and during a recovery period reveals a significantly delayed response after four injections (day 3) (n = 7, 5-12 fish per group), which leads to variable recovery by day 14 (n = 2, 5 fish). (E) One-hour swimming distances are not significantly different between vehicle and paclitaxel-treated fish (n = 2, 5 fish per group). *P < 0.05, **P < 0.01, ****P < 0.0001. D, day; FL, fluorescence; preinj, preinjection day; rec, recovery. |
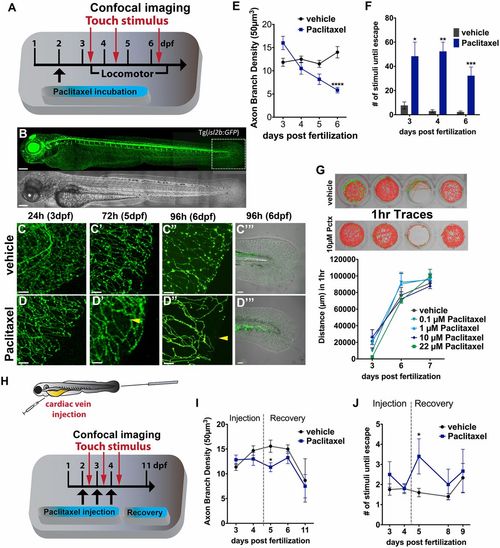
Paclitaxel induces neurotoxicity in larval zebrafish. (A) Scheme of larval paclitaxel (22 µM) incubation and assessment of neuropathy. (B) Image assembly of Tg(isl2b:GFP) zebrafish strain used to analyze axon degeneration in C-E, and I. (Scale bar, 200 µm.) (C and D) Axon branches in caudal fins of vehicle- (C) and paclitaxel- (D) treated larvae after 24, 72, and 96 h (C-D′′). (Scale bar, 20 µm.) Bright field images of fin after 96 h of treatment (C′′′ and D′′′). [Scale bar, 50µm (E).] Reduced axon branch density after 96 h of paclitaxel treatment (n = 3, 5-7 larvae per group). (F) More touch stimuli are required to evoke a response in paclitaxel-treated larvae (n = 3, 10-15 larvae per group). (G, Upper) One-hour sample traces of single vehicle and paclitaxel-treated larvae in each well. Green tracks indicate normal and orange above threshold speed. (G, Bottom) No significant difference in swimming distance (n = 2, 8 fish per group). (H) Scheme of paclitaxel (10 µM) microinjections and axon and behavioral analyses. (I) Axon branch density is significantly reduced after three injections and rapidly recovers. Note that the axon branch density at 11 dpf has also decreased in controls, as the RB neuron population diminishes (n = 3, 8 fish per group). (J) Touch response is transiently delayed after the third injection and restored during recovery (n = 3, 5 fish per group). *P < 0.05, **P < 0.01, ****P < 0.0001. dpf, days postfertilization. |
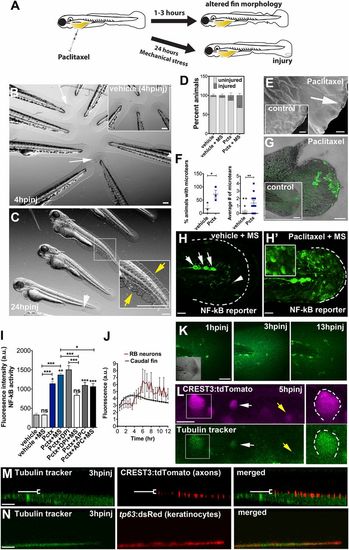
Paclitaxel-induced epithelial damage precedes cutaneous axon degeneration. (A) Scheme of caudal fin phenotypes observed within 3 h after paclitaxel injection in the presence or absence of mechanical stress. (B) Altered fin morphology (arrows) 4 h after paclitaxel injection (Inset shows vehicle-injected controls). (Scale bar, 200 µm.) (C) Disheveled fin-fold (yellow arrows) and skin injury (white arrow) after 24 h. Inset shows higher magnification of boxed region. (Scale bar, 200 µm.) (D) Increased injury formation 24 h after paclitaxel injection, which is exacerbated by mechanical stress (MS) (n = 3, 5 larvae per group). (E) Scanning electron micrographs of distal caudal fins following 3 h of incubation in vehicle (Inset) or paclitaxel. Paclitaxel animal with microtear (arrow) indicates brittle skin. (Scale bar, 10 µm.) (F) Percent of animals with microtears (Left) and average number of microtears per animal (Right; as shown in E) are increased after 3 h of paclitaxel treatment. (G) Increased ROS/H2O2 detection (n = 5 per group) with pentafluorobenzenesulfonyl-fluorescein in the caudal fin of paclitaxel-treated, stressed animals, not seen in the injury site, or in stressed vehicle controls (Inset). (Scale bar, 50 µm.) (H and H′) NF-κB reporter activity after mechanical stress is restricted to neuromasts (white arrows) and dendritic cells (white arrowhead) in control larva (H) and also found in keratinocytes of paclitaxel-treated larva (H′) (Inset shows higher magnification of keratinocytes; see also Fig. S6). (Scale bar, 50 µm.) (I) NF-κB reporter activity with and without H2O2 scavengers in vehicle and paclitaxel-treated stressed and unstressed larvae (n = 3, 3-6 fish per group; *P < 0.05 and ***P < 0.001). (J) Tubulin tracker fluorescence increase in caudal fin peaks around 3 h postinjection (hpinj) and around 5 hpinj in RB neuron cell bodies, shown in K and L (n = 3, 4 fish per group). (K) Tubulin tracker (10 µM) in caudal fin at 3 h following injection. (Scale bar, 100 µm.) (L) Tubulin tracker is present in large (boxed) and small (white arrow) diameter RB neuron cell bodies at 5 hpinj. Note that not all neurons accumulate tubulin tracker (yellow arrow). (Scale bar, 10 µm.) (M) Tubulin tracker does not colocalize with cutaneous axons at 3 hpinj [white bracket indicates axons (red) above tubulin tracker-positive basal layer]. (Scale bar, 10 µm.) (N) Tubulin tracker colocalizes with basal keratinocytes (red) at 3 hpinj. (Scale bar, 10 µm.) APC, apocynin; DPI, diphenyleneiodonium; hpinj, hours postinjection; MS, mechanically stressed; Pctx, paclitaxel. |
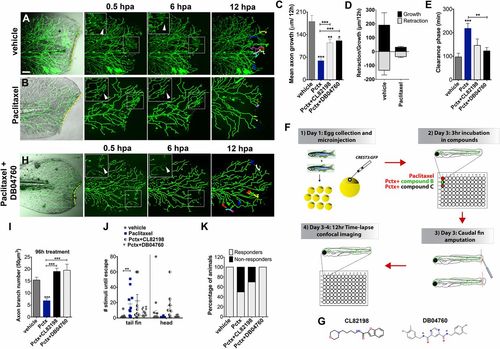
Paclitaxel-induced neurotoxicity in larval fish is attenuated by MMP-13 inhibition. (A and B) Cutaneous branches of a single-labeled RB neuron were traced for 12 h in the caudal fin following fin amputation. Larvae were incubated for 3 h either in vehicle solution (0.5% DMSO/Ringers) (A) or paclitaxel (22 µM) (B). Insets show higher magnification of boxed regions (arrowheads depict axon debris lost in vehicle but not paclitaxel-treated animals). Tracks in the last panel depict branch growth over time. (C) Quantification of mean axon branch growth over 12 h in larvae incubated in vehicle, paclitaxel (22 µM), and paclitaxel plus either DB04760 or CL-82198 (10 µM each) (n = 3, 3-4 fish per group). (D) Comparison of mean axon growth and retraction in injured vehicle and paclitaxel-treated animals over 12 h (n = 2, 3-4 fish and 15 axons per group). (E) Quantification of axon debris clearance (n = 2, 3-4 fish and 5-7 axons per group). (F) Scheme of compound screening assay. (G) Chemical structures of MMP-13 inhibitors. CL-82198, N-[4-(4-morpholinyl)butyl]-2-benzofurancarboxamide; DB04760, N4,N6-bis[(4-fluoro-3-methylphenyl)methyl] pyrimidine-4,6-dicarboxamide. (H) Axon regeneration is partially restored with 10 µM DB04760 (arrowheads mark diminishing axon debris). (I) Comparison of axon branch density following 96 h of treatment (n = 2, 5 fish per group). (J) Touch response in fin and head region after 96 h of treatment (n = 4, 5 fish per group). (K) Percentage of animals with improved touch response upon coadministration of paclitaxel and either CL-82198 or DB04760. *P < 0.05, **P < 0.01, ***P < 0.001. (Scale bar, 50 µm.) hpa, hours postamputation; Pctx, paclitaxel. |
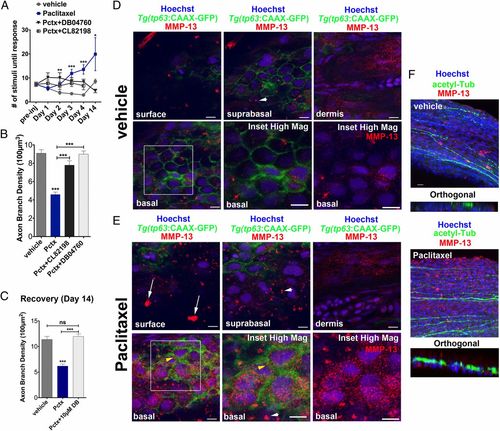
MMP-13 inhibition improves adult paclitaxel-induced neurotoxicity. (A) Improved touch response upon coadministration of paclitaxel and either DB04760 or CL-82198 following four injections (n = 7, 7-12 fish per group) and complete rescue by day 14 in DB04760 coadministered animals (n = 2, 5 fish). (B and C) Axon branch density in distal caudal fin is rescued upon coadministration of paclitaxel and either DB04760 or CL-82198 when assessed 1 d (B) (n = 3, 7-12 fish per group) or 10 d (C) (n = 2, 5 fish per group) after the last injection. (D and E) MMP-13 immunofluorescence staining (red) 1 d after the last injection shows MMP-13 up-regulation specifically in basal keratinocytes (yellow arrowheads) of Tg(tp63:CAAX-GFP) fish injected with paclitaxel (E) and low MMP-13 expression in vehicle controls (D). Imaging was performed using identical settings. Dermal cells in both vehicle and paclitaxel-injected fish have similar MMP-13 expression levels. White arrowheads depict large distinctive MMP-13 clusters. (E) White arrows depict clusters of MMP-13-positive cellular debris at the skin surface, indicative of increased cell shedding. (Scale bar, 5 µm.) (F) MMP-13 staining (red) is adjacent to, but not within, DRG axons (green). (Scale bar, 10 µm.) *P < 0.05, ***P < 0.001, ****P < 0.0001. ac-tub, acetylated tubulin; Pctx, paclitaxel. |
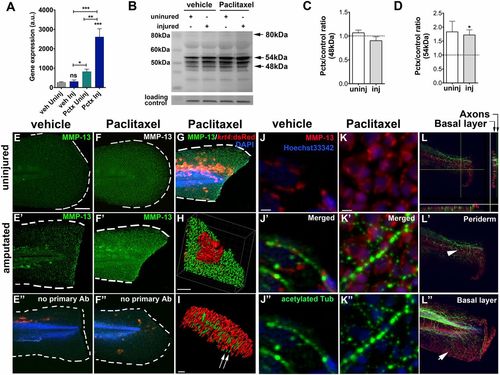
Paclitaxel stimulates MMP-13 expression. (A) Quantitative real-time PCR shows increased mmp13a expression in uninjured and injured animals treated with 22 µM paclitaxel for 3 h (15 pooled larvae per group). (B) Western analysis shows higher abundance of the 54-kDa isoform in uninjured and injured animals treated with paclitaxel for 3 h (10 pooled larvae per group). (C and D) Paclitaxel/vehicle ratios for normalized 48-kDa (C) and 54-kDa (D) bands in uninjured and injured animals (n = 2, 10 pooled larvae). Dashed lines demarcate control levels. (E-F′′) Immunofluorescence staining of MMP-13 in vehicle control (E) is increased at the wound margin after amputation (E′) and is ubiquitous following 3 h of paclitaxel treatment (F and F′). Immunofluorescence staining of larvae transiently injected with krt4:dsRed in the absence of primary MMP-13 antibody (E′′ and F′′). (Scale bar, 50 µm.) (G) Mosaic keratinocyte-specific expression (red) following krt4:dsRed injection and MMP-13 (green) staining shows colocalization. DAPI-stained nuclei. (Scale bar, 50 µm.) (H) 3D rendering of one keratinocyte (red) and MMP-13 staining (green) shows colocalization. (Scale bar, 10 µm.) (I) 3D rendering of axons (acetylated-tubulin, green) and MMP-13 staining (red) shows no colocalization (arrows). (Scale bar, 15 µm.) (J-K′′) MMP-13 staining (J and K) and axons stained with acetylated tubulin (J′′ and K′′) show lack of colocalization in vehicle (J′) and paclitaxel- (K′) incubated larvae. (Scale bars, 5 µm.) (L) Orthogonal views (sidebars) show axons (green) colocalizing with basal cell-specific MMP-13 staining (red). (L′ and L′′) MMP-13 staining (arrow in L′′) is present in the deeper basal layer below the axons (arrowhead) and is absent from the superficial periderm (L′). (Scale bar, 50 µm.) *P < 0.05, **P < 0.01, ***P < 0.001. AB, antibody; a.u., arbitrary units; Inj, injured; Pctx, paclitaxel; Uninj, uninjured; veh, vehicle. |
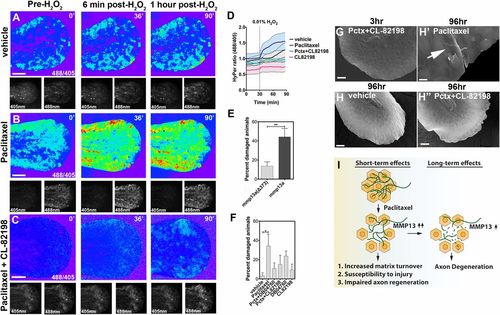
Epithelial defects induced by paclitaxel are rescued upon MMP-13 inhibition. (A-C) Temporal sequence of HyPer oxidation in Tg(krt4:Gal4_tdTomato_5xUAS_HyPer) larva before and after addition of 0.01% exogenous H2O2 at 30 min, visualized as 488/405 nm emission ratio. Vehicle (0.5% DMSO) controls show some oxidation following H2O2 addition (A), which is increased after 3 h of paclitaxel incubation (B) and rescued when CL-82198 is coadministered (C). (Scale bar, 100 µm.) (D) Quantification of HyPer oxidation (n = 2, 4-5 fish per group; paclitaxel vs. paclitaxel + CL-82198; *P = 0.03). (E) Percentage of larvae with skin damage following injection of either wild-type mmp13a or mmp13aΔ373 mRNA into one-cell stage embryos and mechanical stress at 2 dpf (n = 3 biological replicates, 15 larvae per group). (F) Rescue of skin damage following pharmacological inhibition of MMP-13 and mechanical stress at 2 dpf (n = 3, 9-10 larvae per group). (G-H′′) SEM of larvae incubated for 3 h in paclitaxel + CL-82198 (G) and 96 h in vehicle (H), paclitaxel (H′), or paclitaxel + CL-82198 (H′′) shows improved skin morphology with CL-82198. [Scale bar, 25µm (G, H, and H′′) and 5 µm (H′).] (I) Model of paclitaxel-induced peripheral neuropathy. Paclitaxel damages epithelial keratinocytes by up-regulating MMP-13, leading to skin damage due to increased matrix turnover and neurotoxicity. *P < 0.05, **P < 0.01. Pctx, paclitaxel. |
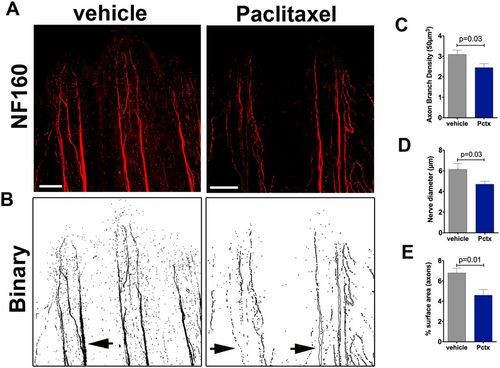
Neurofilament (NF160) staining in adult zebrafish shows decreased axon branch density after paclitaxel injection. (A) Neurofilament (NF160) immunofluorescence staining on day 5 in adult caudal fins following four vehicle or 10-µM paclitaxel injections shows decreased staining of the fine cutaneous axon branches and thick axon bundles along the bony rays. (Scale bar, 100 µm.) (B) Binary images to demonstrate loss of axons in thick axon bundles along the bony rays (arrows). (C and D) Quantification of axon branch density (C), diameter of axon bundles projecting along the bony rays (D), and axonal surface area (E) (five fish per group). |
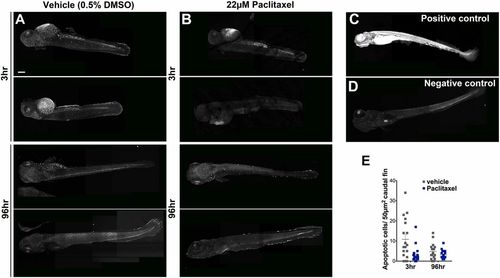
Paclitaxel treatment does not increase apoptosis in larval fish. (A and B) Image assemblies of TUNEL staining in vehicle (A) and paclitaxel (B)-treated larvae following 3 h (Top panels) and 96 h (Bottom panels) of incubation in either DMSO/Ringers solution or paclitaxel. DMSO-treated controls have slightly increased apoptosis compared with paclitaxel-treated larvae. (C) Positive control pretreated with micrococcal nuclease shows ubiquitous staining. (D) Negative control without labeling reagent. (E) Quantification of average apoptotic cell number in 50 µm3 within caudal fins shows a slight (but not significant) increase in apoptosis in DMSO/vehicle controls (six fish per group). (Scale bar, 200 µm.) |
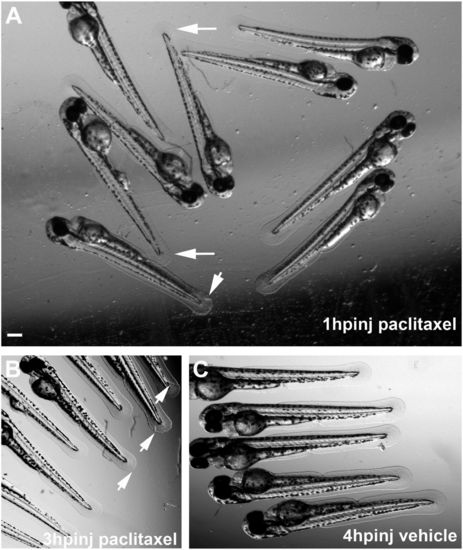
Altered caudal fin morphology following paclitaxel injection into larval fish at 2 dpf. (A) Morphological changes (arrows) in the fin fold 1 h after injection with 10 µM paclitaxel (see also Inset showing a higher magnification). (B) Fin damage (arrows) 3 h after paclitaxel injection. (C) Vehicle controls with undamaged fins 4 h postinjection. (Scale bar, 200 µm.) hpinj, hours postinjection. |
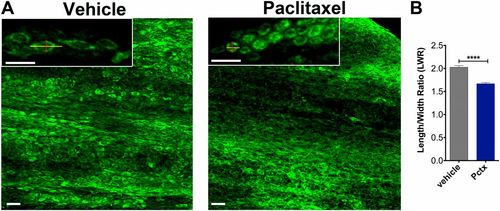
Altered caudal fin morphology following paclitaxel injections into adult fish. (A) The skin of the distal caudal fin in adult fish injected with 10 µM paclitaxel appears disorganized on day 5 compared with vehicle controls when assessed with Bodipy Ceramide staining to outline cellular morphologies. Insets show higher magnifications of cells. Lines depict the length and width of cells as quantified in B. (B) The LWR is decreased after paclitaxel injection, suggesting that cells are more rounded (five fish per group). (Scale bar, 50 µm.) ****P < 0.0001. Pctx, paclitaxel. |
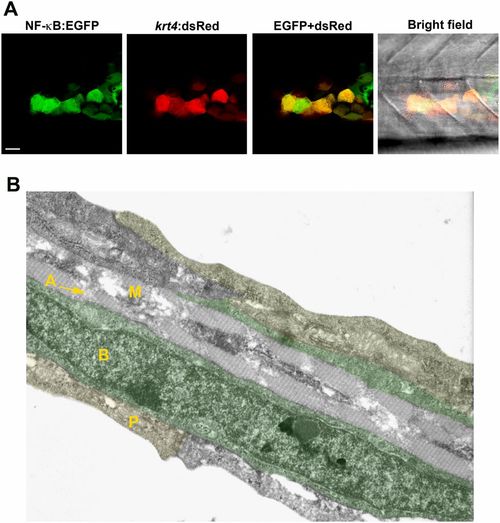
NF-κB activation in keratinocytes. (A) NF-κB activity (green) detected in keratinocytes of a transgenic Tg(NF-κB:EGFP) reporter line that mosaically expresses krt4:dsRed in keratinocytes. (Scale bar, 20 µm.) (B) Cell types present within the caudal fin of a 3-dpf zebrafish larva using transmission electron microscopy. The caudal fin consists of three skin layers: the outer periderm (P, also known as enveloping layer, yellow), the inner basal cell layer (B, marked in green), and the mesenchymal cell layer (M) with actinotrichia (A). RB sensory axons are located between basal cells and periderm (not visible in this image). |
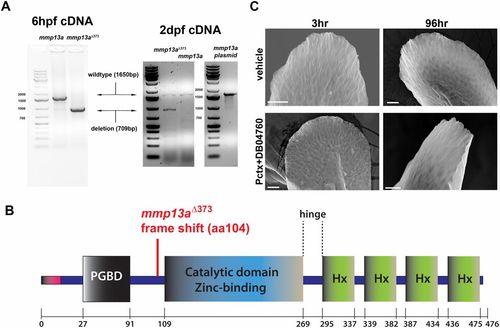
MMP-13 overexpression and rescue of skin phenotypes by MMP-13 inhibition. (A) In the left gel image, RT-PCR for detection of wild-type and nonfunctional mmp13aΔ373 mRNA in which 709 bp are deleted. Both samples contain endogenous mmp13a mRNA. The cDNA was prepared from pools of 15 larvae at 6 h postfertilization (hpf). In the right gel image, mmp13a was amplified from 2-dpf larvae and from an mmp13a-containing plasmid, serving as positive control. (B) Scheme of MMP-13 structural domains and deletion in mmp13aΔ373. (C) Altered fin morphology induced by paclitaxel incubation is rescued upon coadministration of DB04760 for either 3 or 96 h, as assessed by scanning electron microscopy. (Scale bar, 25 µm.) |
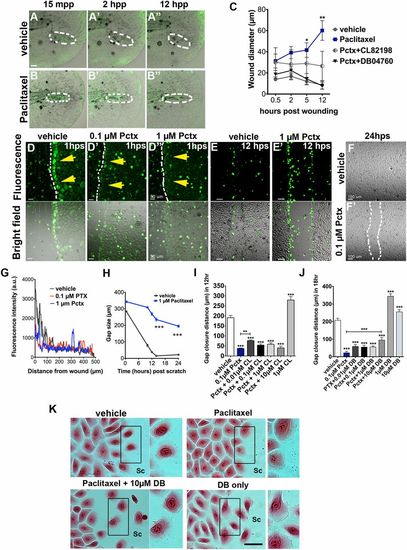
Paclitaxel impairs skin wound repair. (A and B) Rapid repair of a puncture wound (dashed circles) in a vehicle-treated transgenic Tg(tp63:CAAX-GFP) zebrafish larva (A). The puncture wound is retained in a larva incubated in 22 µM paclitaxel (B). Animals were preincubated in 22 µM vehicle or paclitaxel for 3 h, injured, and retained in the treatment solution for 12 h. (Scale bar, 20 µm.) (C) Quantification of wound diameter over 12 h shows rescue of wound repair with MMP-13 inhibitors (n = 2, 4-5 larvae per group). (D, D′, and D′′) Scratch wounding of HEK001 human keratinocytes shows ROS/H2O2 formation at the scratch wound margin of vehicle (yellow arrows, D) but not paclitaxel-treated cells (D′ and D′′). (Scale bar, 50 µm.) (E and E′) ROS/H2O2 formation is present in vehicle (E) and paclitaxel-treated HEK001 cells (E′) after 12 h. (Scale bar, 50 µm.) (F and F′) Healed scratch in vehicle (F) but not paclitaxel-treated wells (F′) after 24 h. (G) ROS/H2O2 fluorescence intensity measured from the scratch margin 1 h postscratch (hps). (Scale bar, 100 µm.) (H) HEK001 scratch wound gap size over time (n = 5; ***P < 0.001). (I) HEK001 gap closure distance at 12 hps following Pctx + CL-82198 or CL-82198 alone administration. (J) HEK001 gap closure distance at 18 hps following Pctx + DB04760 or DB04760 alone administration. (K) Still images (Eosin) of HEK001 cells from J. Insets on the right of each image show higher magnifications of highlighted boxes. Control cells at the scratch margin show decreased cell-cell adhesion and formation of lamellipodia at the leading (migratory) edge, which is absent in paclitaxel-treated cells and rescued with DB04760. DB04760 alone increases the number of cells with lamellipodia formation. (Scale bar, 20 µm.) *P < 0.05, **P < 0.01, ***P < 0.001. a.u., arbitrary units; CL, CL-82198; DB, DB04760; hpp, hours postpuncture; hps, hours postscratch; mpp, minutes postpuncture; Pactx, paclitaxel; SC, scratch. |