
|
Fig. 2
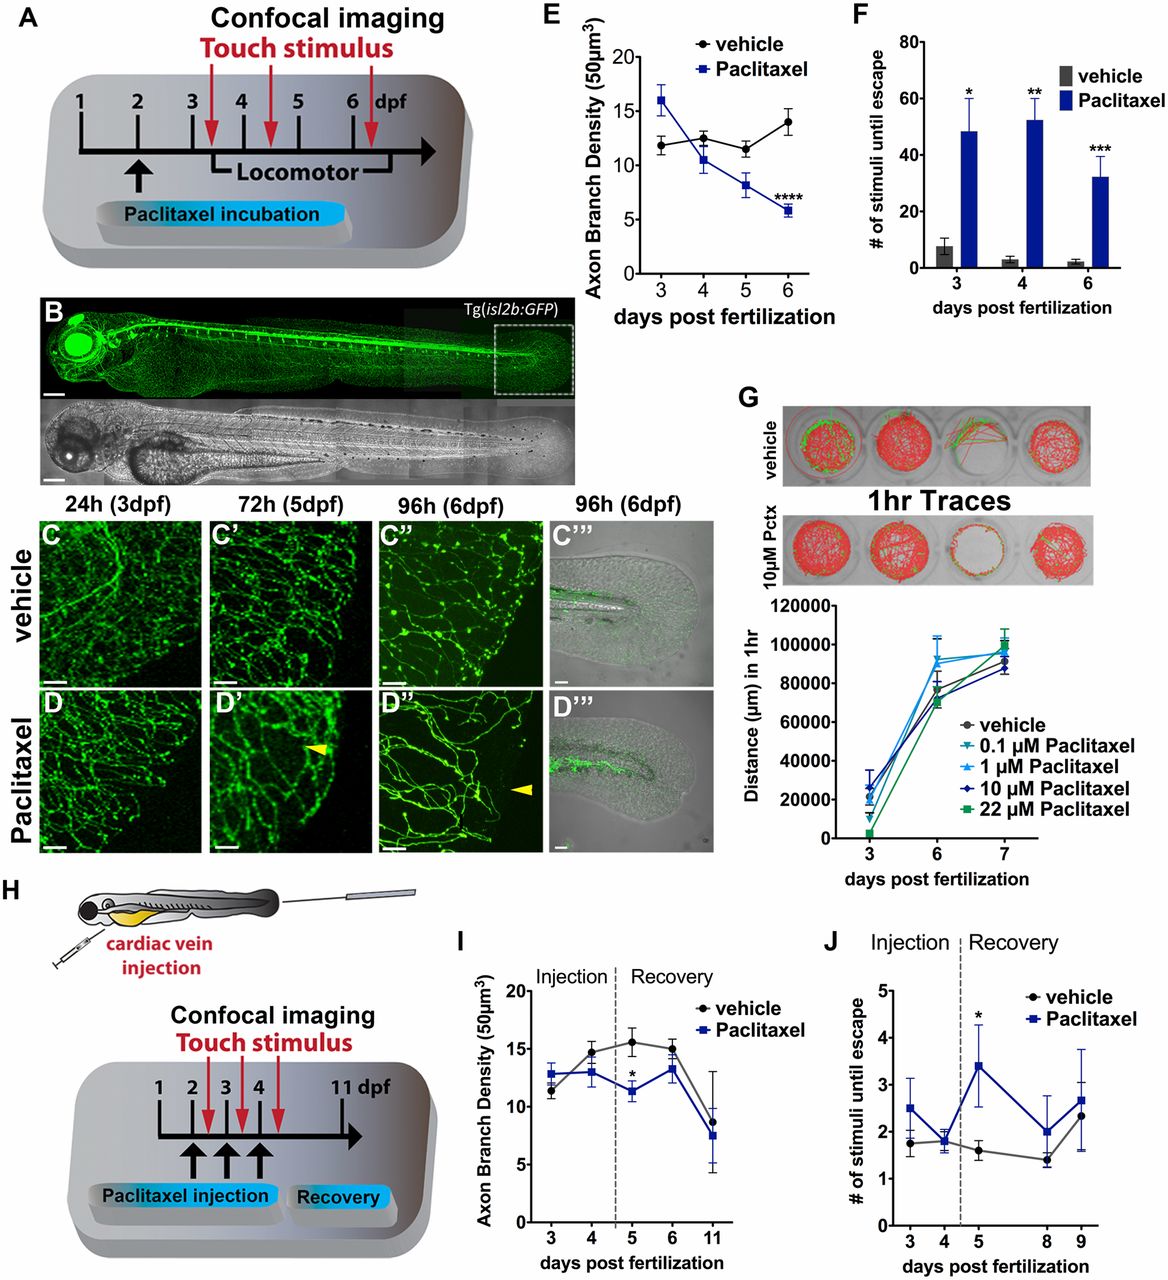
Paclitaxel induces neurotoxicity in larval zebrafish. (A) Scheme of larval paclitaxel (22 µM) incubation and assessment of neuropathy. (B) Image assembly of Tg(isl2b:GFP) zebrafish strain used to analyze axon degeneration in C-E, and I. (Scale bar, 200 µm.) (C and D) Axon branches in caudal fins of vehicle- (C) and paclitaxel- (D) treated larvae after 24, 72, and 96 h (C-D′′). (Scale bar, 20 µm.) Bright field images of fin after 96 h of treatment (C′′′ and D′′′). [Scale bar, 50µm (E).] Reduced axon branch density after 96 h of paclitaxel treatment (n = 3, 5-7 larvae per group). (F) More touch stimuli are required to evoke a response in paclitaxel-treated larvae (n = 3, 10-15 larvae per group). (G, Upper) One-hour sample traces of single vehicle and paclitaxel-treated larvae in each well. Green tracks indicate normal and orange above threshold speed. (G, Bottom) No significant difference in swimming distance (n = 2, 8 fish per group). (H) Scheme of paclitaxel (10 µM) microinjections and axon and behavioral analyses. (I) Axon branch density is significantly reduced after three injections and rapidly recovers. Note that the axon branch density at 11 dpf has also decreased in controls, as the RB neuron population diminishes (n = 3, 8 fish per group). (J) Touch response is transiently delayed after the third injection and restored during recovery (n = 3, 5 fish per group). *P < 0.05, **P < 0.01, ****P < 0.0001. dpf, days postfertilization.