
Fig. 3
- ID
- ZDB-IMAGE-160707-22
- Publication
- Lisse et al., 2016 - Paclitaxel-induced epithelial damage and ectopic MMP-13 expression promotes neurotoxicity in zebrafish
- All Figures
- Figures for Lisse et al., 2016
|
Fig. 3
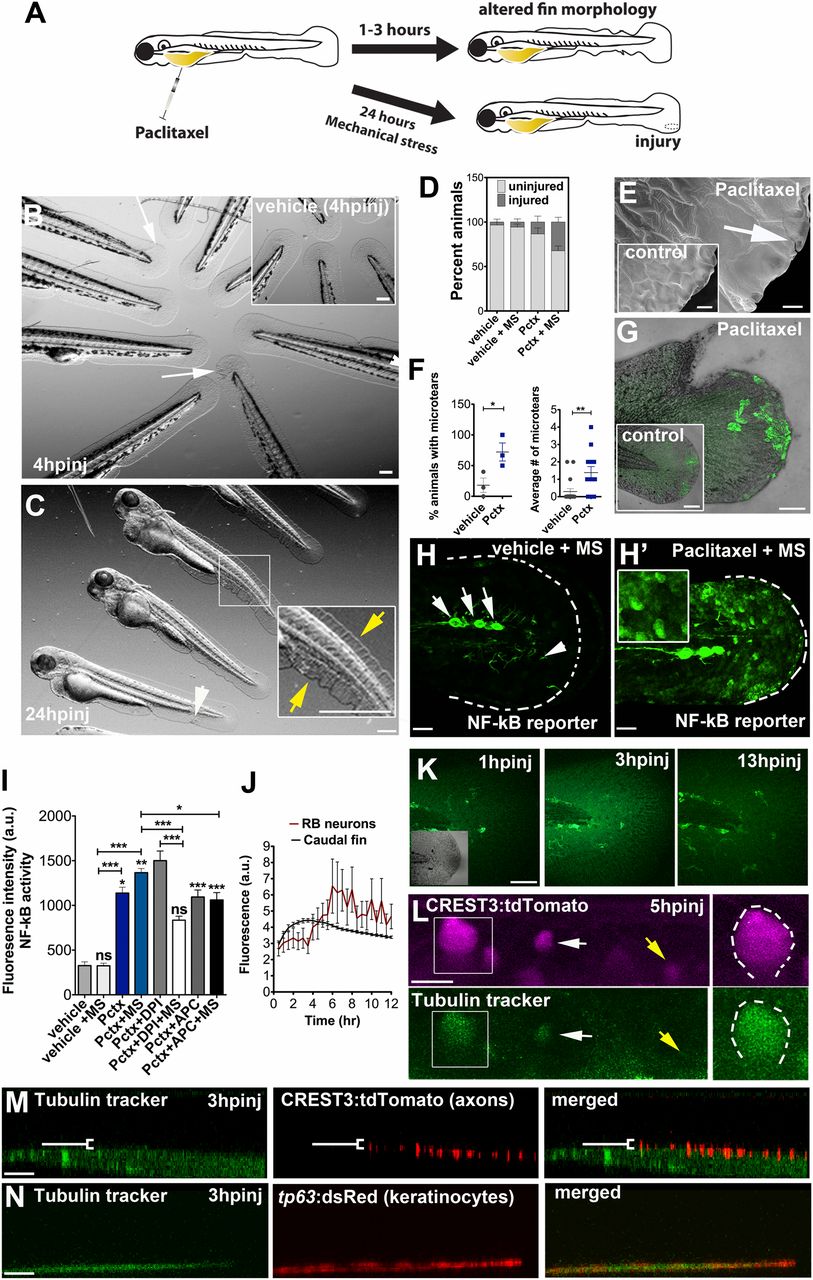
Paclitaxel-induced epithelial damage precedes cutaneous axon degeneration. (A) Scheme of caudal fin phenotypes observed within 3 h after paclitaxel injection in the presence or absence of mechanical stress. (B) Altered fin morphology (arrows) 4 h after paclitaxel injection (Inset shows vehicle-injected controls). (Scale bar, 200 µm.) (C) Disheveled fin-fold (yellow arrows) and skin injury (white arrow) after 24 h. Inset shows higher magnification of boxed region. (Scale bar, 200 µm.) (D) Increased injury formation 24 h after paclitaxel injection, which is exacerbated by mechanical stress (MS) (n = 3, 5 larvae per group). (E) Scanning electron micrographs of distal caudal fins following 3 h of incubation in vehicle (Inset) or paclitaxel. Paclitaxel animal with microtear (arrow) indicates brittle skin. (Scale bar, 10 µm.) (F) Percent of animals with microtears (Left) and average number of microtears per animal (Right; as shown in E) are increased after 3 h of paclitaxel treatment. (G) Increased ROS/H2O2 detection (n = 5 per group) with pentafluorobenzenesulfonyl-fluorescein in the caudal fin of paclitaxel-treated, stressed animals, not seen in the injury site, or in stressed vehicle controls (Inset). (Scale bar, 50 µm.) (H and H′) NF-κB reporter activity after mechanical stress is restricted to neuromasts (white arrows) and dendritic cells (white arrowhead) in control larva (H) and also found in keratinocytes of paclitaxel-treated larva (H′) (Inset shows higher magnification of keratinocytes; see also Fig. S6). (Scale bar, 50 µm.) (I) NF-κB reporter activity with and without H2O2 scavengers in vehicle and paclitaxel-treated stressed and unstressed larvae (n = 3, 3-6 fish per group; *P < 0.05 and ***P < 0.001). (J) Tubulin tracker fluorescence increase in caudal fin peaks around 3 h postinjection (hpinj) and around 5 hpinj in RB neuron cell bodies, shown in K and L (n = 3, 4 fish per group). (K) Tubulin tracker (10 µM) in caudal fin at 3 h following injection. (Scale bar, 100 µm.) (L) Tubulin tracker is present in large (boxed) and small (white arrow) diameter RB neuron cell bodies at 5 hpinj. Note that not all neurons accumulate tubulin tracker (yellow arrow). (Scale bar, 10 µm.) (M) Tubulin tracker does not colocalize with cutaneous axons at 3 hpinj [white bracket indicates axons (red) above tubulin tracker-positive basal layer]. (Scale bar, 10 µm.) (N) Tubulin tracker colocalizes with basal keratinocytes (red) at 3 hpinj. (Scale bar, 10 µm.) APC, apocynin; DPI, diphenyleneiodonium; hpinj, hours postinjection; MS, mechanically stressed; Pctx, paclitaxel.