
- Title
-
Efficient extravasation of tumor-repopulating cells depends on cell deformability
- Authors
- Chen, J., Zhou, W., Jia, Q., Chen, J., Zhang, S., Yao, W., Wei, F., Zhang, Y., Yang, F., Huang, W., Zhang, Y., Zhang, H., Zhang, Y., Huang, B., Zhang, Z., Jia, H., Wang, N.
- Source
- Full text @ Sci. Rep.

Establishment of a zebrafish model to quantify mouse melanoma cell behaviors in vivo.(a) Schematic of experimental protocols. (b) Left panels: Representative images show that 500 tfRFP B16 cells were injected into the yolk sac (white arrow) of a zebrafish. Right panels: the fish was divided into three main sections (Head, Trunk and Tail) to quantitate metastatic sites of the tumor cells. Scale bar, 500 µm. (c) Approximately five hundred tfRFP B16 cells were injected into the yolk sac of 2 day post-fertilization (2 dpf) embryos. Left, middle, and right panels: fluorescent images of the fish at 0, 3, and 6 dpi. Images are representative of >100 injected embryos. Arrowheads indicate disseminated tumor foci (single tumor cells or cell aggregates). Color code: in (a), embryos are yellow, mouse melanoma cells are red; in (c), zebrafish blood vessels are green and melanoma cells are red. Scale bar, 500 µm. Inset: yellow-dashed line rectangle box is the enlarged image of the small yellow box above; scale bar, 100 µm. |
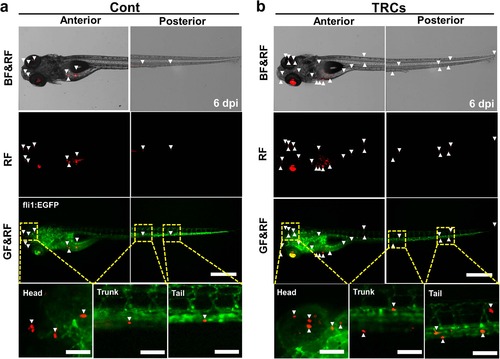
TRCs exhibit more metastases.The same number (~500 cells) of tfRFP melanoma cells cultured on 2D rigid plastic for 5 days (Cont) or in 3D 90-Pa fibrin gels for 5 days (TRCs) was injected into the yolk of 2 dpf embryos respectively. Representative images show metastatic tumor foci at 6 dpi zebrafish, comparing the TRCs group (b) with the Cont group (a). Arrowheads point to disseminated tumor foci (single tumor cells or tumor cell aggregates). There are more arrowheads in the TRCs group, suggesting more metastases. Color code: Zebrafish blood vessels are green, and melanoma cells are red; BF = brightfield; GF = Green Fluorescence; RF = tfRFP Fluorescence. Scale bars, 500 µm. |

Silencing Sox2 inhibits metastasis of TRCs.Sox2 shRNA (a) and scrambled shRNA (b) treated TRCs were injected into the yolk of 2 dpf Tg(kdrl:mCherry) embryos respectively; cell proliferation, survival, and metastasis were quantified every 24 hr from 0 dpi to 6 dpi respectively. Representative images show metastatic tumor foci at 6 dpi zebrafish by comparing the scrambled shRNA group with the Sox2 shRNA group. Arrowheads indicate disseminated tumor foci or tumor foci aggregates. Color code: Sox2 shRNA or scrambled shRNA treated TRCs are green; zebrafish blood vessels are red. Scale bars, 500 µm. |

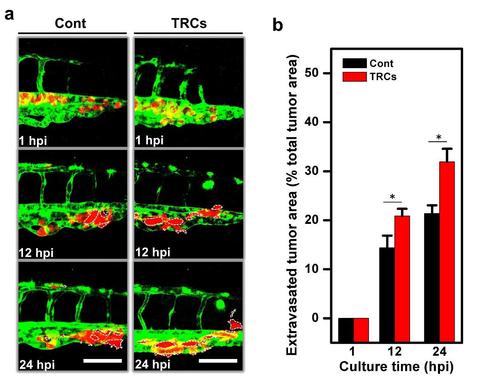
TRCs extravasate more effectively than control melanoma cells in vivo.(a) Schematic of injecting tumor cells into the pericardium of the fish. (b) A low resolution confocal image showing injected tumor cells (white arrow) being moved to the tail (yellow dashed-line box) 1 hr after injection. Scale bar, 1 mm. (c) TRCs and Cont were injected into the pericardium of 48 hpf embryos respectively. Images in each panel (246 µm × 246 µm) corresponding to the yellow dashed-line box area in (b) were acquired with high resolution confocal microscopy (63 × objective), showing vessel penetration of Cont (left panels) or TRCs (right panels) at 1 (yet to penetrate), 12 and 24 hpi respectively and summarized in (d). Acquired images were stacked in z-axis and vessel boundaries were outlined to quantify the cell areas that were out of the vessels as extravasated areas and that were inside the vessels. Dashed white lines mark the tumor extravasated areas (i.e., various sizes of micrometastases) from vessels to surrounding tissues. Insets were 3D-images reconstructed using Imaris software that correspond to respective blue dashed boxes, showing tumor cells stay inside the vessels at 1 hpi and extravasated gradually at 12 and 24 hpi. Scale bars, 100 µm; Insets scale bars, 20 µm. It is of interest to note that the extravasated cells are in general cell aggregates. (d) Quantification of extravasated tumor area relative to the total tumor area at different time points: 1, 12, and 24 hpi. Color code: Zebrafish blood vessels are green, and mouse tumor cells are red. TRCs exhibit higher penetration rates than Cont. (n >6 fish per group; e3 independent experiments). Mean + s.e.m.; *p < 0.05. |
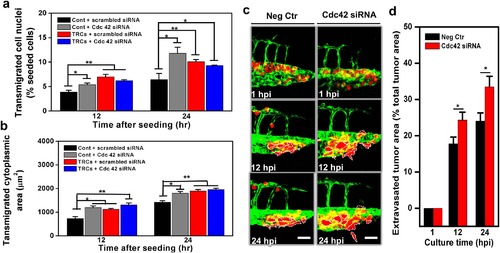
Silencing Cdc42 in control melanoma cells elevates transmigration in vitro and extravasation in vivo.Transmigration of control melanoma cells or of TRCs through 3-µm pore membrane transwell was measured after the cells were transfected with siRNA to Cdc42 or scrambled siRNA. (a) Transmigrated cell nuclei is the percentage of transmigrated cell nuclei (% seeded cells) per view-field. (b) Transmigrated cytoplasmic area is the total transmigrated cytoplasmic area per view-field. Mean + s.e.m.; n = 3 independent experiments. *p < 0.05, **p < 0.01, ***p < 0.001. (c) Control melanoma cells transfected with scrambled siRNA (Neg Ctr) or Cdc42 siRNA were injected into the pericardium of 48 hpf embryos respectively. Images in each panel show vessel penetration of Neg Ctr (left panels) or Cdc42 siRNA (right panels) at 1, 12, and 24 hpi respectively. Dashed white lines mark the tumor extravasation areas (i.e., various sizes of micrometastases) from vessels to surrounding tissues. Scale bars, 50 µm. (d) Quantification of extravasated tumor area relative to the total tumor area at different time points: 1, 12, and 24 hpi. Color code: Zebrafish blood vessels are green, and mouse tumor cells are red. Mean + s.e.m.; n >10 fish per group from 3 independent experiments; *p < 0.05. |

Stiffening TRCs via actin polymerization decreases transmigration in vitro and extravasation in vivo.Transwell migration of TRCs were compared with that of control melanoma cells before or after actin was polymerized by addition of Jasplakinolide. (a) Transmigrated cell nuclei is the percentage of transmigrated cell nuclei (% seeded cells) per view-field. (b) Transmigrated cytoplasmic area is the total transmigrated cytoplasmic area per view-field. For (a) and (b), Mean ± s.e.m.; n = 3 independent experiments. *p < 0.05, **p < 0.01, ***p < 0.001. (c) TRCs and Cont pretreated with or without Jasp were injected into the pericardium of 48 hpf embryos respectively. Representative images were acquired with high resolution confocal microscopy (63x objective), showing penetration of Cont ± Jasp (left panels) or TRCs ± Jasp (right panels) at 12 and 24 hpi respectively. Dashed white lines mark the tumor extravasation areas (various sizes of micrometastases) from vessels to surrounding tissues. + Jasp: tumor cells were pretreated with 100 nM Jasp in culture medium for 12 hr before collecting; - Jasp: tumor cells were pretreated with DMSO at the same concentration to Jasp in culture medium for 12 hr before collecting. Scale bars, 100 µm Insets scale bars, 20 µm. (d) Quantification of extravasated tumor area relative to the total tumor area at different time points: 12, and 24 hpi. Color code: Zebrafish blood vessels are green, and mouse tumor cells are red. TRCs exhibit higher penetration rates than Cont. Mean ± s.e.m.; n >6 fish per group; 3 independent experiments; *p < 0.05. |
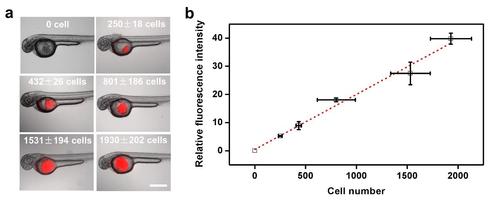
Calibration of cell number in zebrafish. (a) Representative images of 2 dpf zebrafish injected with different numbers of tumor cells into the yolk. Red color are tfRFP B16 melanoma cells. (b) Calibration of the number of injected tumor cells into the yolk with relative fluorescence intensity (corresponding to the projected fluorescence area multiplying fluorescence intensity). Injected cells were counted using a cell counter in vitro before and after injection. Projected fluorescence area and intensity were quantified using ImageJ. Dashed line is the linear fit of the data. Mean±s.e.m.; n≥10 larvae. Scale bar, 500 µm. |
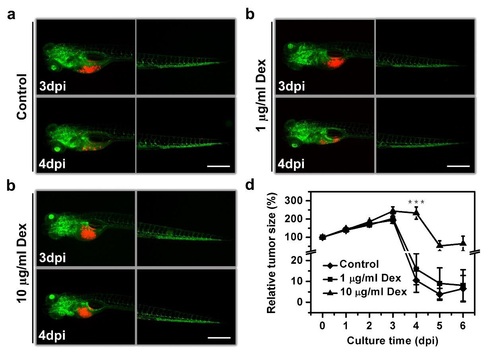
Immune suppression facilitates tumor cell survival in the yolk. Approximately 500 tfRFP-B16 cells were injected into the yolk sac of fish at 2 dpf. At 4 dpf (2 dpi), dexamethasone (Dex) dissolved in ethanol was added into the water at a final concentration of 1 or 10 µg/ml to fish culture for 2 days to inhibit the immune system. The corresponding ethanol-containing water (0.1%) was used as a negative control (Control). Vessels are green and tumor cells are red. Scale bars, 500 µm. (d) Quantification shows that tumor cells survived much better in fish when immune system was inhibited by 10 µg/ml Dex. Mean+s.e.m.; n=12 larvae for each condition; ***p < 0.001. |

Time-course analysis of metastasis of control melanoma cells. Approximately 500 melanoma cells cultured on rigid dish were injected into the yolk sac of zebrafish and the tumor progression were monitored every 24 hr. Representative images from a fish were acquired from 0 dpi to 5 dpi. Arrows indicate primary tumors, arrowheads indicate disseminated tumor foci or tumor foci aggregates. Color code: zebrafish blood vessels are green, and melanoma cells are red. Scale bars, 500 µm. |

Time-course analysis of metastasis of TRCs. The protocols and labels were identical to those in Supplementary Fig. 2 except that TRCs were injected. Scale bars, 500 µm. |
Serum deprivation demonstrates that TRCs extravasate more effectively than control melanoma cells in vivo. (a) TRCs and Cont after serum deprivation (0.1% serum containing medium cultured tumor cells for 24 hrs before injection) were injected into the pericardium of 48 hpf embryos respectively. Images in each panel show vessel penetration of Cont (left panels) or TRCs (right panels) at 1, 12, and 24 hpi respectively. Dashed white lines mark the tumor extravasation areas (i.e., various sizes of micrometastases) from vessels to surrounding tissues. Scale bars, 100 µm. (b) Quantification of extravasated tumor area relative to the total tumor area at different time points: 1, 12, and 24 hpi. Color code: Zebrafish blood vessels are green, and mouse tumor cells are red. TRCs exhibit higher penetration rates than Cont. Mean± s.e.m.; n>6 fish per group; ≥3 independent experiments. *p< 0.05. |

Injected tumor cells move to the tail via blood vessels. Tg (flil1:egfp) embryos at 20 hpf were treated with 2 µM SU5416 for 1 hr (+SU5416) to inhibit vasculogenesis24; the control fish were treated with 0.02% DMSO for 1 hr (- SU5416). After 1 hr, SU5416 or DMSO was washed out by changing fish media. At 48 hpf, tfRFP-B16 cells were injected into the pericardium cavity of fish. Representative images show that tumor cells moved to the tail in a drug-free larva, while no tumor cells moved to the tail in a drug-treated larva after new vessels were inhibited by SU5416. Insets are enlarged images from each corresponding tip of the tail indicated by white arrows. Dashed white lines mark extravasated tumor cells at 12 hpi. Vessels are green and tumor cells are red. –SU5416, 6 other larvae exhibit similar behaviors; +SU5416, 3 other larvae exhibit similar behaviors. Scale bars, 500 µm. Insets, 100 µm. |
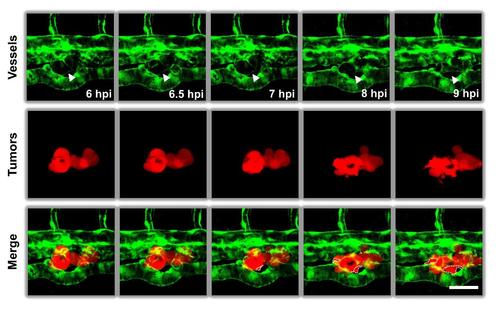
High resolution microscopy of time-course of TRCs extravasation. TRCs arrested at the blood vessels of the zebrafish tail extravasated gradually into peripheral tissues. Time-lapse images were acquired using confocal microscopy at 30-min intervals. White arrowheads indicated the boundaries of vessels. White dashed lines circled projected areas of extravasated TRCs. Color code: zebrafish blood vessels are green, and melanoma cells are red. Scale bar: 50 µm. |

TRCs extravasate more effectively than control melanoma cells in vivo after co-injection. (a) TRCs were transfected with pEYFP-N1 and Cont were transfected with pECFP-N1 respectively, then mixed and co-injected at 1:1 ratio into the cavity of pericardium of 48 hpf embryos. Images in the first two panels show penetration area of Cont (left panels) or TRCs (right panels) at 1, 6, 12, and 24 hpi respectively, and the next two panels show images of vessels and 3-color overlays respectively. Dashed red lines mark the tumor extravasation areas from vessels to surrounding tissues. Scale bars, 100 µm. Total tumor cell volumes were quantitatively similar at 1, 6, and 12 hpi for Cont and TRCs, suggesting that the cell numbers were similar. (b) Quantification of extravasated tumor area relative to the total tumor area at different time points: 1, 6, 12, and 24 hpi. Color code: Zebrafish blood vessels are red, Cont are cyan, and TRCs are yellow. Mean± s.e.m.; n>6 fish per group; ≥3 independent experiments. *p< 0.05. |

Softening shSox2 TRCs via actin depolymerization increases tumor extravasation in fish. TRCs were transfected with GFP-Sox2 shRNA (green) on the top of soft fibrin gels for 12 hrs, then treated with 0.1 µM Latrunculin A (Lat A) for 1 hr and 0.004% DMSO was used as a control. For DMSO-treated group, pECFP-N1 plasmids were co-transfected into GFP-shSox2-TRCs; for Lat A-treated group, non-fluorescent vector plasmids were co-transfected into GFP-shSox2-TRCs. Two types of tumor cells were mixed and co-injected at 1:1 ratio into the cavity of pericardium of 48 hpf embryos. (a) Representative images show tumor cells coextravasation at 1, 6, 12, and 24 hpi. Dashed red lines mark tumor extravasation areas from vessels to surrounding tissues. DMSO-treating cells (control) are cyan, Lat Atreating cells (Lat A) are green, and vessels are red. Scale bars, 100 µm. (b) Quantification of extravasated tumor areas at 1, 6, 12, and 24 hpi. Note that 0.1 µM Lat A significantly increased the extravasation of shSox2-TRCs. Mean±s.e.m.; n=18 larvae; *p < 0.05. |

Differentiation of TRCs with retinoic acid inhibits extravasation of TRCs in vivo. (a) TRCs treated with retinoic acid (RA, 10 µM) or DMSO (0.1%) for 12 hrs were transfected with pECFP-N1 and pEYFP-N1 respectively. The cells were mixed and co-injected at 1:1 ratio into the pericardium of 48 hpf embryos. Images in the first two panels show penetration area of RA-TRCs (left panels) or DMSO-TRCs (right panels) at 1, 6, 12, and 24 hpi respectively, and the next two panels show zebrafish vessels and merges respectively. Dashed red lines mark the tumor extravasation areas (i.e., various sizes of micrometastases) from vessels to surrounding tissues. Scale bars, 100 µm. (b) Quantification of extravasated tumor area relative to the total tumor area at different time points: 1, 6, 12, and 24 hpi. Color code: Zebrafish blood vessels are red, RA-TRCs are cyan, and DMSO-TRCs are yellow. DMSO-TRCs exhibit higher penetration rates than RA-TRCs. Mean±s.e.m.; n>6 fish per group; ≥3 independent experiments. *p< 0.05. |
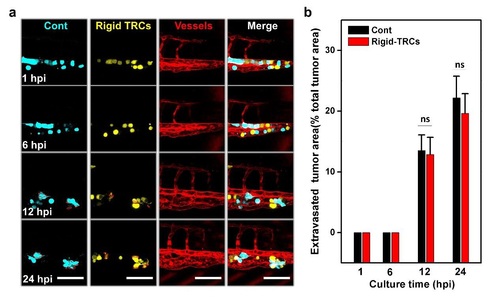
Rigid TRCs extravasate at a similar rate as control melanoma cells. (a) TRCs were collected and cultured onto rigid plastic for 7 days (Rigid-TRCs) then transfected with pEYFP-N1, and control melanoma cells (Cont) cultured on the rigid plastic were transfected with pECFP-N1. Transfected tumor cells were mixed and co-injected at 1:1 ratio into the cavity of pericardium of 48 hpf embryos. Images in the first two panels show penetration area of control melanoma cells (left panels) and rigid TRCs (right panels) at 1, 6, 12, and 24 hpi respectively, and the next two panels show images of vessels and 3-color overlays. Dashed red lines mark tumor extravasation areas from vessels to surrounding tissues. Scale bars, 100 mm. (b) Quantification of extravasated area relative to the total area at the fish tail at different time points: 1, 6, 12, and 24 hpi. Note that there is no extravasation difference between control melanoma cells and rigid TRCs. Color code: Zebrafish blood vessels are red, control melanoma cells are cyan, and rigid TRCs are yellow. Mean±s.e.m.; n=27 larvae; ns = not statistically significant (p=0.86 at 12 hpi; p=0.6 at 24 hpi). |