
|
Fig. S23
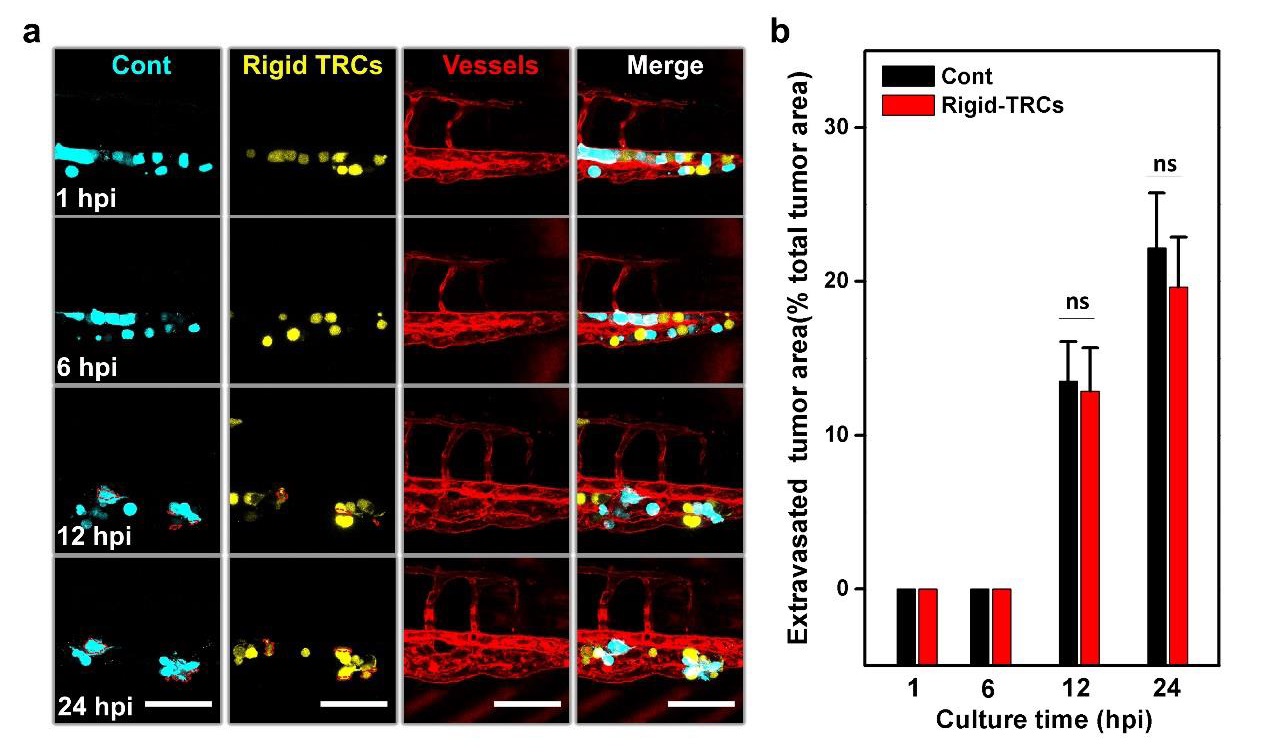
Rigid TRCs extravasate at a similar rate as control melanoma cells. (a) TRCs were collected and cultured onto rigid plastic for 7 days (Rigid-TRCs) then transfected with pEYFP-N1, and control melanoma cells (Cont) cultured on the rigid plastic were transfected with pECFP-N1. Transfected tumor cells were mixed and co-injected at 1:1 ratio into the cavity of pericardium of 48 hpf embryos. Images in the first two panels show penetration area of control melanoma cells (left panels) and rigid TRCs (right panels) at 1, 6, 12, and 24 hpi respectively, and the next two panels show images of vessels and 3-color overlays. Dashed red lines mark tumor extravasation areas from vessels to surrounding tissues. Scale bars, 100 mm. (b) Quantification of extravasated area relative to the total area at the fish tail at different time points: 1, 6, 12, and 24 hpi. Note that there is no extravasation difference between control melanoma cells and rigid TRCs. Color code: Zebrafish blood vessels are red, control melanoma cells are cyan, and rigid TRCs are yellow. Mean±s.e.m.; n=27 larvae; ns = not statistically significant (p=0.86 at 12 hpi; p=0.6 at 24 hpi).