
- Title
-
An insulin signaling feedback loop regulates pancreas progenitor cell differentiation during islet development and regeneration
- Authors
- Ye, L., Robertson, M.A., Mastracci, T.L., Anderson, R.M.
- Source
- Full text @ Dev. Biol.
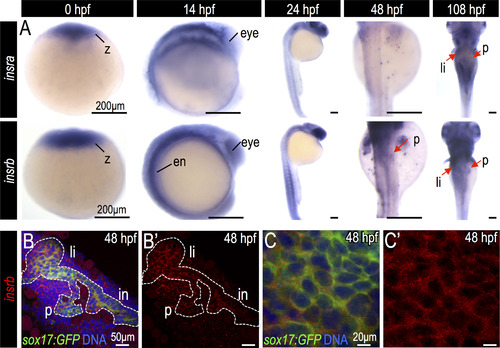
Expression of insulin and insulin receptors during zebrafish endoderm development. (A) In situ hybridization for insra and insrb in the developing zebrafish embryos. (B–C) Fluorescent in situ hybridization of insrb (red) in Tg(sox17:GFP) endoderm (green) at 48 hpf. Abbreviations: z, zygote; ed, endoderm; p, pancreas; li, liver; in, intestine. |
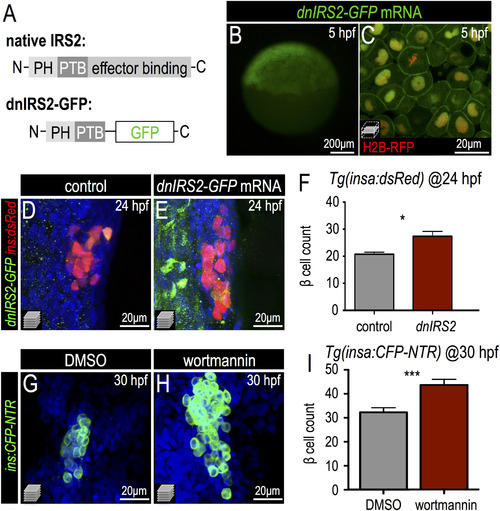
Insulin signaling blockade increases embryonic β cell formation. (A) Schematic of a dominant negative IRS2 construct designed to block transmission of insulin signaling; C-terminal effector binding domains are replaced with GFP. (B,C) 5 hpf embryo injected with dnIRS2-GFP mRNA (B) Photomicrograph of epifluorescence shows ubiquitous distribution of GFP. (C) Confocal plane shows the localization of dnIRS2-GFP to the plasma membrane while co-injected H2B-RFP mRNA labels cell nuclei red. (D,E) Confocal projections of control (D) and dnIRS2-GFP mRNA-injected islets in 24 hpf Tg(ins:dsRed) embryos. (F) Quantification of insa:dsRed+ β cells in 24 hpf control (n=12) and dnIRS2-GFPmRNA injected embryos (n=10). (G,H) Confocal projections of DMSO-treated control (G) and 1 µM wortmannin-treated islets in 30 hpf Tg(ins:CFP-NTR) embryos. (I) Quantification of β cells in DMSO-treated control (n=18) and 1 µM wortmannin-treated (n=17) islets in 30 hpf embryos. Student t-test was used to determine significance in F and I. |
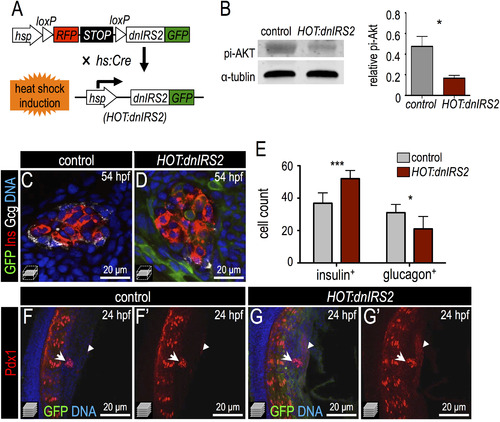
Inducible genetic blockade of insulin signaling promotes β cell formation. (A) Schematic of genetic insulin signaling blockade strategy. In double transgenic embryos, heat shock induces Cre expression and recombination of the mCherry-switch-dnIRS2-GFP transgene as well as expression of the recombined dnIRS2-GFP transgene. (B) Immunoblot of pi-Akt in Cre-negative control versus Cre-positive embryos showing that induction of dnIRS2-GFP effectively blocks insulin signaling. (C,D) Confocal planes of 54 hpf control and HOT:dnIRS2 islets stained for GFP (green), Insulin (red), and Glucagon (white). Embryos were heat shocked repeatedly, at 10, 24, 28, 32, 36, and 48 hpf; dnIRS2-GFP was induced ubiquitously, but only in Cre-positive HOT:dnIRS2 embryos. (E) Quantification of Insulin+ β cells and Glucagon+ α cells in control (gray, n=8) and dnIRS2-expressing HOT:dnIRS2 (red, n=6) groups. (F–G′) Merged and single channel confocal projections of 24 hpf control and HOT:dnIRS2 pancreatic endoderm stained for GFP (green) and Pdx1 (red). dnIRS2-GFP is induced ubiquitously in HOT:dnIRS2 embryos, which show expanded Pdx1 protein expression in the principal islet (arrows) and adjacent ventral endoderm (arrowheads). Student t-test was used in B and two-way ANOVA was used in E to determine significance. |
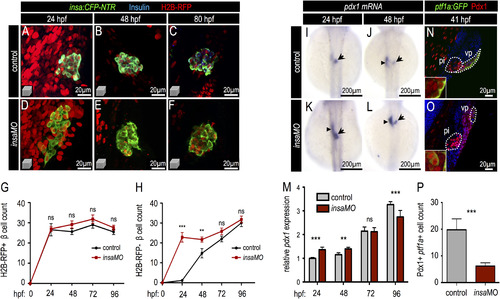
Insulin knockdown increases Pdx1 expression and drives early pancreatic progenitor differentiation into β cells. (A–F) Confocal projections of 24 hpf, 48 hpf, and 80 hpf Tg(insa:CFP-NTR) control (A–C) and insaMO-injected (D–F) islets that were co-injected with H2B-RFP mRNA to distinguish dorsal (H2B-RFP-positive DBCs) and ventral (H2B-RFP-negative VBCs) bud-derived β cells. Islets were immuno-stained for CFP (β cells, green) and insulin (blue). Insulin protein was not detectable in insaMO-injected islets. (G,H) Quantification of H2B-RFP-positive DBCs (G) and H2B-RFP-negative VBCs (H) in control (black line) and insaMO-injected (red line) islets from 24 hpf to 96 hpf (ne8 islets at each stage). VBC count is increased early at 24 and 48 hpf, but normalizes to control levels by 72 hpf. (I–L) In situ hybridization of pdx1 expression in 24 hpf and 48 hpf control (I,J) and insaMO-injected (K,L) embryos. pdx1 expression was increased in the principal islet (arrow) and adjacent endoderm (arrow heads). (M) Real time PCR to detect Pdx1 expression in both control and insaMO-injected embryos from 24 hpf to 96 hpf (n=3). (N,O) Confocal planes of 41 hpf Tg(ptf1a:GFP) control (N) and insaMO-injected (O) endoderm stained for GFP (green) and Pdx1(red). Pdx1 expression was increased while ptf1a:GFP expression was decreased in insaMO-injected embryos. (P) Quantification of double positive Pdx1+ ptf1a+ pancreatic progenitor cells in both control (n=6) and insaMO (n=6) injected embryos. Abbreviations: pi, principal islet; vp, ventral pancreas. ANOVA was used in G,H, and O and Student′s t-test was used in P to determine significance. EXPRESSION / LABELING:
|
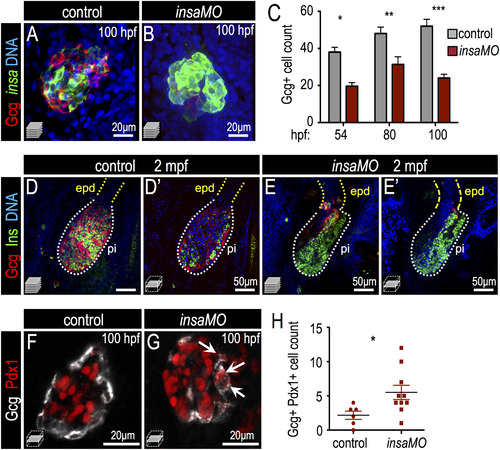
Insulin knockdown impairs α cell development and destabilizes α cell fate. (A,B) Confocal projections of 100 hpf Tg(insa:CFP-NTR) control (A) and insaMO-injected (B) islets stained for Glucagon (red) and CFP (β cells, green). α cell count is decreased and α/beta; cell architecture is inverted. (C) Quantification of Glucagon-positive cells in 54 hpf, 80 hpf and 100 hpf control (gray) and insaMO-injected (red) islets (n ≥ 5 for all time points except 54 hpf control, n=3). (D–E′) Confocal projections (D,E) and confocal planes (D′,E′) of 2 months post fertilization (mpf) control (D,D′) and insaMO-injected (E,E′) islets stained for Glucagon (red), Insulin (green) and DNA (blue). Reduction of α cell mass was sustained into adult stages. (F,G) Confocal planes of 100 hpf control (F) and insaMO-injected (G) islets immunostained for Glucagon (white) and Pdx1 (red). Double positive Glucagon+ Pdx1+ cells (arrows) were increased with insaMO-injection. (H) Quantification of double positive Glucagon+ Pdx1+ cells in 100 hpf control (n=6) and insaMO-injected (n=10) islets. Two way ANOVA was used in C and Student′s t-test was used in H to determine significance. EXPRESSION / LABELING:
PHENOTYPE:
|
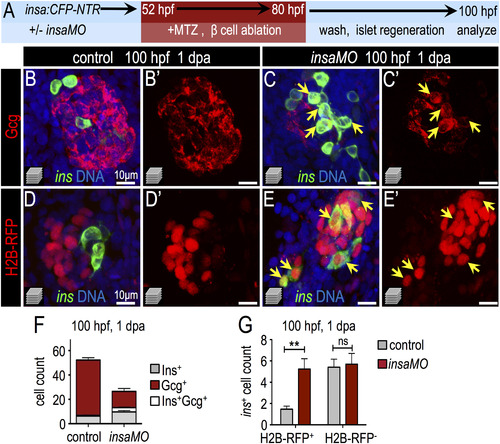
Insulin knockdown enhances regeneration of β cells. (A) Schematic of β cell ablation and regeneration experiments. Control and insaMO-injected insa:CFP-NTR embryos were treated with MTZ from 52 to 80 hpf, recovered in fresh egg water for 1 day, and analyzed at ~100 hpf (1 day post ablation; dpa). (B–C′) Merged (B,C) and single channel (B′,C′) confocal projections of regenerated 100 hpf control (B,B′) and insaMO-injected (C,C′) islets immunostained for Gcg (red), CFP (β cells, green), and DNA (blue). Arrows indicate the expansion of strongly double positive Ins+ Gcg+ cells. (D–E′) Merged (D,E) and single channel (D′,E′) confocal projections of 100 hpf control (D,D′) and insaMO-injected (E,E′) islets immunostained for CFP (green) and DNA (blue). All islets expressed zygotically-injected H2B-RFP (red) to mark DBCs. Arrows indicate the expansion of double positive H2B-RFP+ Ins+ cells; this indicates conversion of non-β endocrine cells into β cells. (F) Quantification of insa+, Gcg+, and insa+ Gcg+ cells in 1 dpa control (n=17) and insaMO-injected (n=22) islets. (G) Quantification of H2B-RFP+ insa+ and H2B-RFP-insa+ regenerating β cells in 1 dpa control (n=17) and insaMO-injected (n=13) islets. Student′s t-test was used in G to determine statistical significance. |
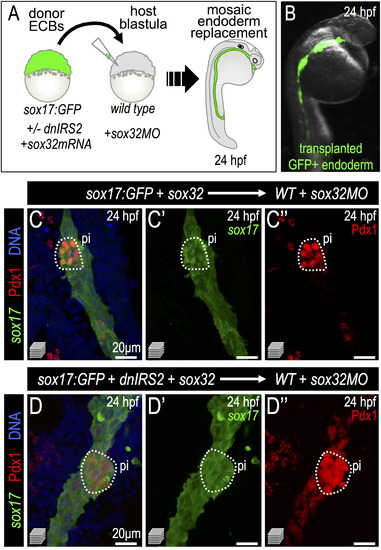
Insulin signaling blockade in transplanted endodermal committed blastomeres promotes Pdx1 expression. (A) Scheme of endoderm replacement transplantation experiments. sox32-injected blastomeres termed “Endoderm Committed Blastomeres” (ECBs) were isolated from donor Tg(sox17:GFP) blastulae with or without injected dnIRS2-GFP mRNA. ECBs were transplanted into endoderm deficient, sox32MO-injected host blastulae. (B) 24 hpf chimera shows extensive replacement of endogenous endoderm with transplanted Tg(sox17:GFP) donor cells. (C–D′′) Merged and single channel confocal projections of 24 hpf embryos with endoderm transplants from sox32 mRNA (C–C3, n=8) or sox32 and dnIRS2 mRNA (D–D′′, n=7) injected donors. Embryos were immunostained for GFP (green), Pdx1 (red), and DNA (blue). dnIRS2-GFP-expressing endoderm showed increased Pdx1 expression. |
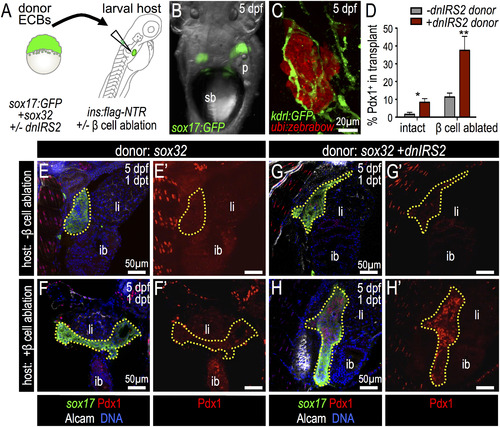
Insulin signaling blockade in endodermal committed blastomeres promotes Pdx1 expression after transplantation into β-cell ablated hosts. (A) Blastula ECB to 4 dpf Tg(insa:flag-NTR) larva cell transplantation scheme. (B) 5 dpf host shows Tg(sox17:GFP) donor cells at 1 day post transplantation (dpt). (C) Confocal projection of Tg(kdrl:GFP) (green) host with transplanted Tg(ubi:zebrabow) donor cells (red) at 1 dpt shows engraftment. (D) Percentage of transplanted ECBs that are Pdx1-positive. Chimeras were generated with the following four combinations: (1) wild type ECBs (dnIRS2) into non-ablated host (n=4); (2) ECBs +dnIRS2 into non-ablated host (n=6); (3) wild type ECBs (dnIRS2) into β ablated host (n=6); and (4) ECBs +dnIRS2 into β ablated host (n=8). (E–H′) Merged and single channel confocal planes of chimeras showing Tg(sox17:GFP) donor ECBs (outlined) at 1 dpt, stained for GFP (green), Pdx1 (red), Alcam (white), and DNA (blue). (E–F′) sox32 mRNA-injected blastomeres transplanted into β intact (E′E′) and β cell-ablated hosts (F–F′). Few transplanted ECBs expressed Pdx1. (G–H′) sox32 and dnIRS2 mRNA-injected blastomeres transplanted into β cell-intact (G–G′) and β cell-ablated (H–H′) hosts. Loss of β cells increases Pdx1 expression in transplanted ECBs. Student t-test was used for statistical analysis in D. Abbreviations: sb, swim bladder; p, pancreas; ib, intestine bulb; li, liver. |
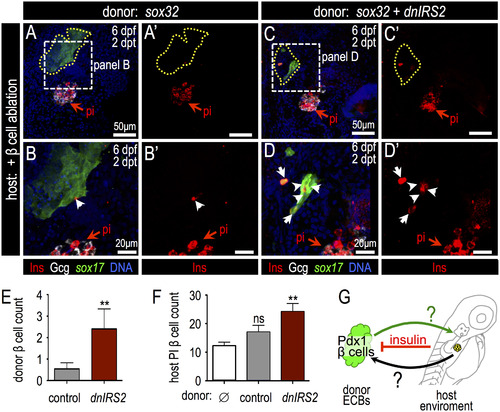
Insulin signaling blockade in ECB donor cells promotes Insulin expression and host β cell regeneration. (A-D′) Merged and single channel confocal projections of transplanted Tg(sox17:GFP) donor ECBs in β cell-ablated host larvae stained for GFP (green), Insulin (red) and Glucagon (white) at 2 days post transplantation (dpt). (B-B′, D-D′) Higher magnification of boxed region in panels A-A′ and C-C′, respectively. In (A-B′) donor cells were injected with sox32 mRNA only; in (C-D′) donor ECBs had been zygotically-injected with sox32 and dnIRS2 mRNAs. Cells derived from the ECB transplant are bounded by a dotted yellow line and the principal islet (pi) of the host is indicated by a red arrow. (E) Quantification of Insulin+ β cells in donor ECBs that were transplanted into β cell ablated hosts; dnIRS2 (n=11), +dnIRS2 (n=10). Blockade of insulin signaling with dnIRS2 increased the production of insulin-positive β cells. (F) Quantification of host-derived regenerated β cells in the principal islet (pi) after transplantation with no cells (sham control, n=12), donor ECBs injected with sox32 mRNA alone (n=11), or ECBs injected with sox32 plus dnIRS2 mRNAs (n=11). (G) Model for the role of insulin signaling in regulating β cell differentiation and reciprocal interactions between transplanted endoderm-committed blastomeres and the host environment. Student′s t-test was used in E and one-way ANOVA was used in F to determine significance. Abbreviation: pi, host larvae principal islet at 2 days post β cell ablation. |
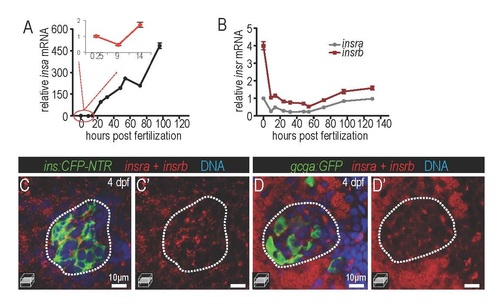
Expression of insulin and insulin receptors during development. (A-B) real-time PCR analysis of insulin a (insa), insulin receptor a (insra) and insulin receptor b (insrb) in embryos. n=3 for each time point. Inset graph shows magnified detail of circled region. (C-D) fluorescent in situ hybridization indicating the expression of insra + insrb (red) in pancreatic tissues, including the islet β (ins:CFP-NTRM in C, green) and α cells (gcga:GFP in D, green). |
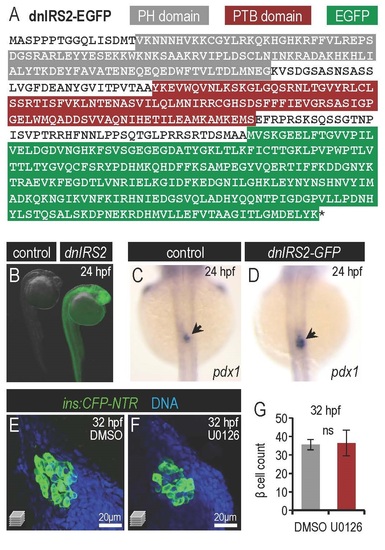
Insulin signaling blockade via dnIRS2-GFP mis-expression and drug treatments. (A) Peptide sequence of dnIRS2-GFP transgene showing pleckstrin homology (PH), phosphotyrosine binding (PTB) and GFP domains. (B) Control and dnIRS2-GFP mRNAinjected embryos at 24 hours post fertilization (hpf). (C,D) In situ hybridization showing pdx1 expression in control (C) and dnIRS2-GFP mRNA-injected (D) embryos. pdx1 expression is expanded with insulin signaling blockade. (E,F) Confocal projections of 30 hpf Tg(ins:CFP-NTR) pancreatic islets treated with DMSO as a vehicle control (E) or 1µM wortmannin (F). (G) Quantification of β cells in DMSO-treated control (n=10) and 100 µM U0126-treated (n=9) islets at 32 hpf. No change in β cell number was observed with U0126-mediated MAPK inhibition. Student’s t-test was used to determine significance in G. |
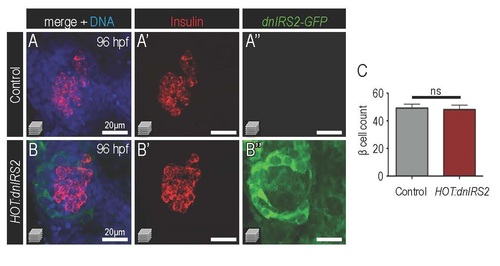
Pancreatic β cell mass normalizes to wild type levels at 96 hpf after continual induction of HOT:dnIRS2. (A-B′′) Merged and single channel confocal projections of 96 hpf HOT:dnIRS2 Cre- control (A-A′′) and HOT:dnIRS2 (B-B′′) islets after heat shock at 10 hpf, 24 hpf, 28 hpf, 32 hpf, 36 hpf, 48 hpf, 56 hpf ,72 hpf and 80 hpf. Ubiquitous induction of dnIRS2- GFP occurs only in the Cre+ embryos. (C) Quantification of β cells in 96 hpf HOT:dnIRS2 Cre-control (n=12) and HOT:dnIRS2 (n=10) islets; β cell mass is indistinguishable between the two conditions. Student’s t-test was used to determine significance in C. |
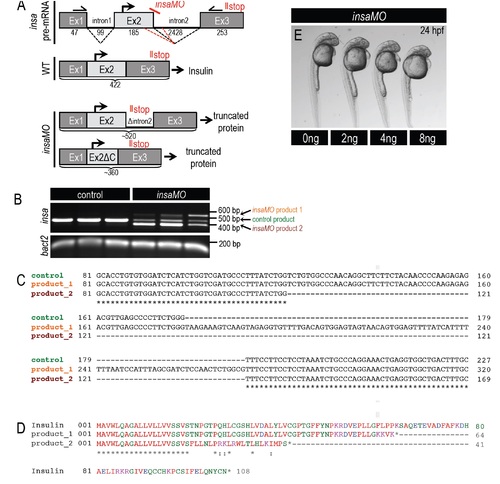
Knockdown of insulin via insulin-a morpholino (insaMO). (A) Diagram illustrating insa pre-mRNA structure in wild type and insaMO-injected cells. insaMO targets the exon 2-intron 2 boundary of preproinsulin-a mRNA and generates two nonsense alternative splicing products. Primers complementary to exon 1 and exon 3 amplify the differentially spliced cDNA products. (B) Agarose gel showing PCR amplified insa cDNA products; mRNA was extracted from control and insaMO-injected embryos at 2 days post fertilization (dpf). Note that a single PCR product with size of 420 bp was detected in control embryos but two aberrant PCR products—520 and 360 bp—were detected in insaMO-injected embryos. β actin was used as internal control. (C) The PCR products in control and insaMO-injected embryos were extracted, cloned into pJet vector, and sequenced. insaMO-injected embryos showed two aberrant splice products: Product 1 included intronic sequence; Product 2 showed partial deletion of exon 2. (D) Predicted peptide sequence of control and two aberrant splice products. (E) No overt gross embryonic phenotypes resulted from injection of increasing doses of insaMO ranging from 2 ng to 8 ng. |
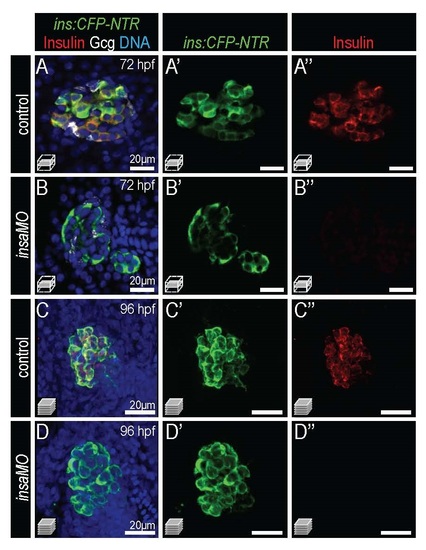
Sustained absence of Insulin protein by insaMO at 72 and 96 hpf. Merged and single channel confocal images of 72 hpf (A-B′′) and of 96 hpf (C-D′′) Tg(ins:CFP-NTR) control (A-A′& C-C′′) and insaMO-injected (B-B′ & D-D′′) islets stained for CFP (β cells, green), insulin (red) and glucagon (white). Insulin protein was undetectable in β cells at both stages. |
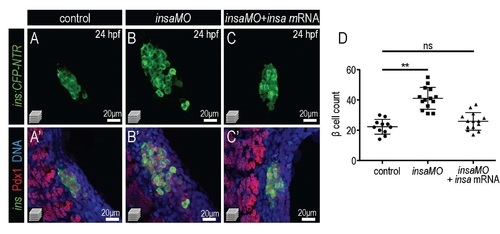
Co-injection of insa mRNA rescues the expansion of β cells in insaMO-injected islets. (A-C′) Merged and single channel confocal projection of 24 hpf Tg(ins:CFP-NTR) control (A,A′), insaMO-injected (B,B′), and insaMO + insa mRNA-injected (C,C′) islets immunostained for CFP (β cells, green), Pdx1 (red), and DNA (blue). (D) Quantification of β cells in control, insaMO-injected, and insaMO + insa mRNA-injected islets. The expansion of β cell mass observed in insaMO-injected islets is rescued when insa mRNA is co-injected. |
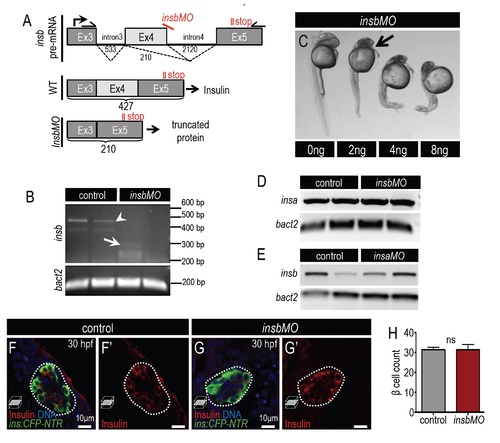
Knockdown of insb results in severe developmental defects. (A) Diagram illustrating insb pre-mRNA structure in wild type and insbMO-injected cells. insbMO targets the exon 4-intron 4 boundary of preproinsulin-b mRNA and promotes the deletion of exon 4. Primers complementary to exon 3 and exon 5 amplify the differentially spliced cDNA products. (B) Agarose gel showing amplified insb PCR product from 2 dpf control and insbMO-injected embryos. Note that a PCR product with a size of 427 bp was detected in control embryos (arrowhead) but not insbMO injected embryos. A weak product of 210 bp can be detected in insbMO-injected embryos (arrow). β actin was used as an internal control. (C) Dose dependent phenotypes at 48 hpf after insbMO injection. Arrow indicates head defect first observed at 2 ng insbMO dose. (D,E) RT-PCR analysis of cDNA in 30 hpf insbMO-injected (D) and insaMOinjected (E) embryos. Neither insbMO nor insaMO affected the splicing or expression of the mRNA of the respective paralog. (F-G′) Merged and single channel confocal planes of 24 hpf control (F,F′) and insbMO-injected (G,G′) islets of Tg(ins:CFP-NTR) embryos stained for CFP (β cells, green) and insulin (red). (H) Quantification of ins:CFP-NTR+ β cells in 24 hpf control (n=5) and insbMO-injected embryos (n=6). Student′s t-test was used to determine significance in H. |
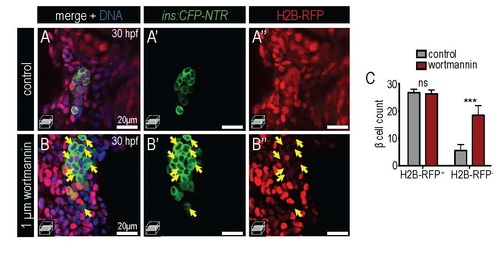
Treatment of PI3K inhibitor wortmannin increases β cell differentiation from ventral endoderm. (A-B′′) Merged and single channel confocal planes of 30 hpf control (A-A′′) and 1 µM wortmannin-treated (B-B′′) islets zygotically-injected with H2B-RFP mRNA and stained with CFP (β cells, green). It is noted that majority of control β cells were H2B-RFPpositive but significant portion of H2B-RFP-negative β cells (yellow arrows) were detected in wortmannin-treated embryos. (C) Quantification of DBCs (H2B-RFP-positive) and VBCs (H2BRFP- negative) in 30 hpf DMSO-treated control (n=12) and 1µM wortmannin treated embryos (n=15). One-way ANOVA was used in C for statistical analysis. |
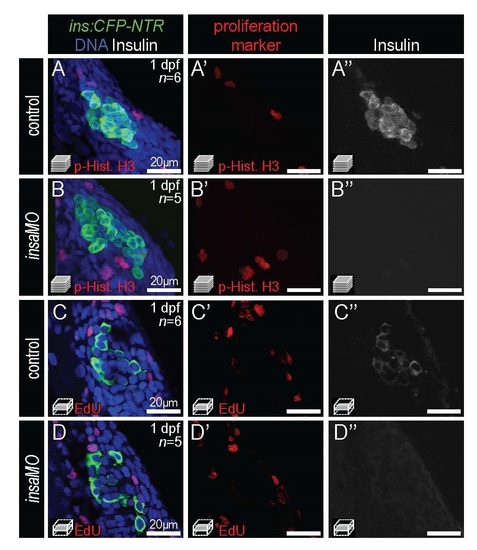
insaMO does not increase β cell proliferation. (A-B′′) Merged and single channel confocal projections of 1 dpf control (A-A′′; n=6) and insaMO-injected (B-B′′; n=5) Tg(ins:CFP-NTR) islets stained with CFP (β cells, green), phospho-Histone H3 (red), and insulin (white). (C-D′′) Merged and single channel confocal planes of 1 dpf control (C-C′′; n=6) and insaMO-injected (D-D′′; n=5) Tg(ins:CFP-NTR) islets stained with CFP (β cells, green), EdU (red) and Insulin (white). |
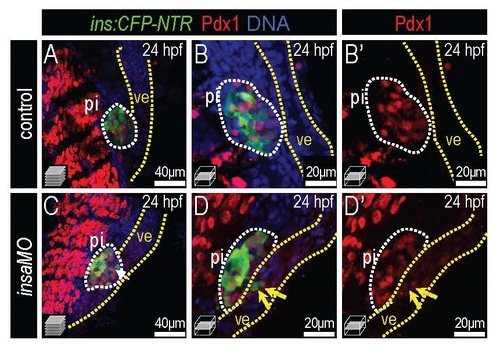
Insulin knockdown induces ectopic Pdx1 expression in ventral endoderm. Merged and single channel confocal images of 24 hpf control (A-B′) and insaMO-injected (C-D′) Tg(ins:CFP-NTR) islets immunostained for CFP (β cells, green), Pdx1 (red), and DNA (blue). (A) Confocal projection and (B-B′) higher power magnification confocal plane of control islet. (C) Confocal projection and (D-D′) higher power magnification confocal plane of insaMO-injected islet. Note the formation of β cells from Pdx1+ ventral endoderm (ve) in insaMO-injected embryos (yellow arrow). Abbreviation: pi, principal islet. |
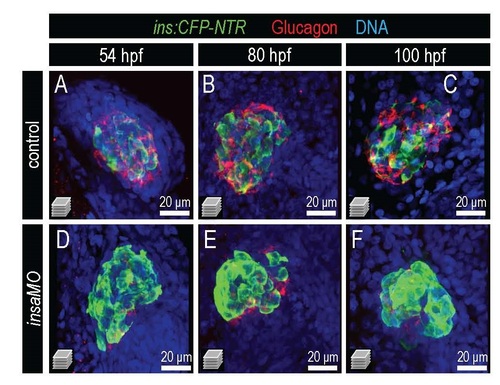
Insulin knockdown disrupts islet structure and α cell development. Confocal projections of control and insaMO-injected islets from Tg(ins:CFP-NTR) embryos immunostained for CFP (β cells, green), Glucagon (red), and DNA (blue) at 54 hpf (A,D), 80 hpf (B,E) and 100 hpf (C,F). Islets in insaMO-injected embryos are dysmorphic with insulin-positive β cells aberrantly surrounding a diminished number of Glucagon-positive α cells. |
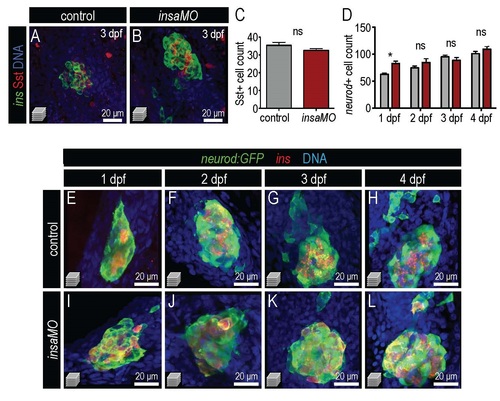
Insulin knockdown has no effect on δ cell number or total endocrine cell number. (A,B) Confocal projections of 3 dpf control (A) and insaMO-injected (B) islets immunostained for Insulin (green), Somatostatin (red), and DNA (blue). (C) Quantification of somatostatin-positive cells in control (n=5) and insMO-injected (n=6) embryos at 3 dpf. No significant change was evident in δ cell mass. (D) Quantification of endocrine cells in control and insaMO-injected embryos from 1 dpf to 4 dpf. n≥7 for all time points. (E-L) Confocal projections of control (E-H) and insaMO (I-L) islets in doubly transgenic Tg(neurod:GFP); Tg(ins:dsRed)embryos. Student’s t-test was used in C and two way ANOVA was used in D to determine significance. |
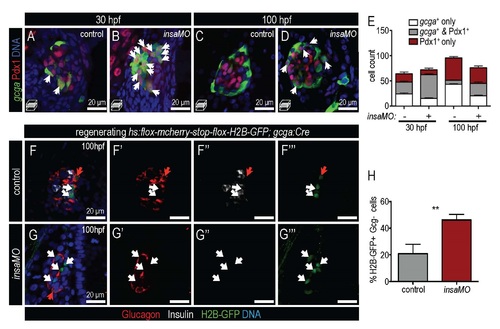
insulin knockdown increases α cell plasticity. (A-D) Confocal planes show control (A,C) and insaMO-injected (B,D) Tg(gcga:GFP) islets at 30 hpf (A,B) and 100 hpf (C,D) immunostained for Pdx1 (red) and DNA (blue). An increased number of double positive Gcg+ Pdx1+ cells are indicated by arrows. (E) Quantification of gcga:GFP+ (white) , gcga:GFP+ Pdx1+ (gray), and Pdx1+ (red) cells in control and insaMO-injected embryos at 30 hpf and 100 hpf. n≥7 for all time points. (F-G′′′) Confocal planes showing β cell regeneration after MTZ treatment in control (F-F′′′) and insaMO-injected (G-G′′) triply transgenic Tg(ins:Flag-NTR); Tg(hs:loxp-mcherry-loxp-H2BGFP); Tg(gcga:cre)s962 islets immunostained for Insulin (white) , GFP (green), Glucagon (red), and DNA (blue). Red arrows indicate H2B-GFP+ Glucagon+ cells, which have retained α cell character, while white arrows indicate H2B-GFP+ Glucagon- cells, which have lost α cell character during β cell regeneration. (H) Percentage of the H2B-GFPpositive cell population that is Gcg-negative in control (n=7) and insaMO-injected regenerating (n=13) islets. More lineage-labeled α cells lost glucagon expression in insaMO-injected islets than in control, suggesting increased plasticity. Student’s t-test was used in H to determine significance. |
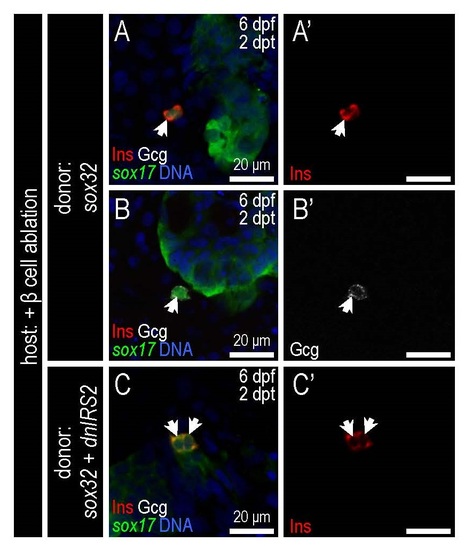
Transplanted endoderm-committed blastomeres (ECBs) can differentiate into pancreatic endocrine cells in β cell ablated host larvae. (A-C′) Merged and single channel confocal planes of chimeras composed of Tg(sox17:GFP) ECBs transplanted into β cell-ablated host larvae, shown at 2 days post transplantation (dpt)/6 dpf. Chimeras were immunostained for GFP (green), Insulin (red), Glucagon (white), and DAPI (blue). (A,B) Control donor ECBs, and (C) dnIRS2-GFP mRNA-injected ECBs. With insulin signaling blockade, insulin+ β cell generation was increased in donor ECBs, while Glucagon+ α cell generation was decreased. |
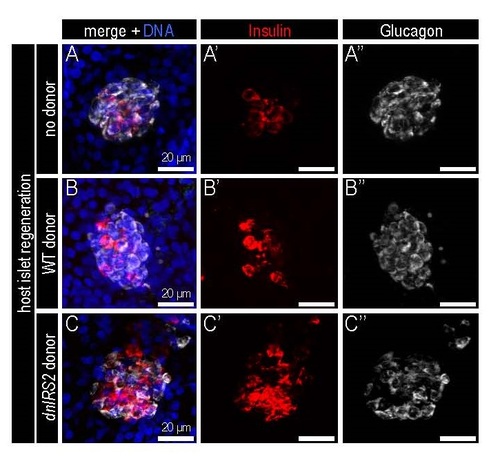
Transplantation of ECBs influences host β cell regeneration in the principal islet. (A-C) Confocal projections of host-derived regenerating principal islets within chimeras at 2 days post ablation. Chimera composition was: (A-A′′) Sham donor control without transplantation (B-B′′); control donor Tg(sox17:GFP) ECBs; and (C-C′′) dnIRS2-GFP mRNAinjected donor Tg(sox17:GFP) ECBs. Chimeras were immunostained for Insulin (red), Glucagon (white), and DNA (blue). Regeneration of β cells was increased in the principal islet of the host when insulin signaling was blocked by dnIRS2-GFP in the transplanted ECBs. |
Reprinted from Developmental Biology, 409(2), Ye, L., Robertson, M.A., Mastracci, T.L., Anderson, R.M., An insulin signaling feedback loop regulates pancreas progenitor cell differentiation during islet development and regeneration, 354-69, Copyright (2016) with permission from Elsevier. Full text @ Dev. Biol.