
|
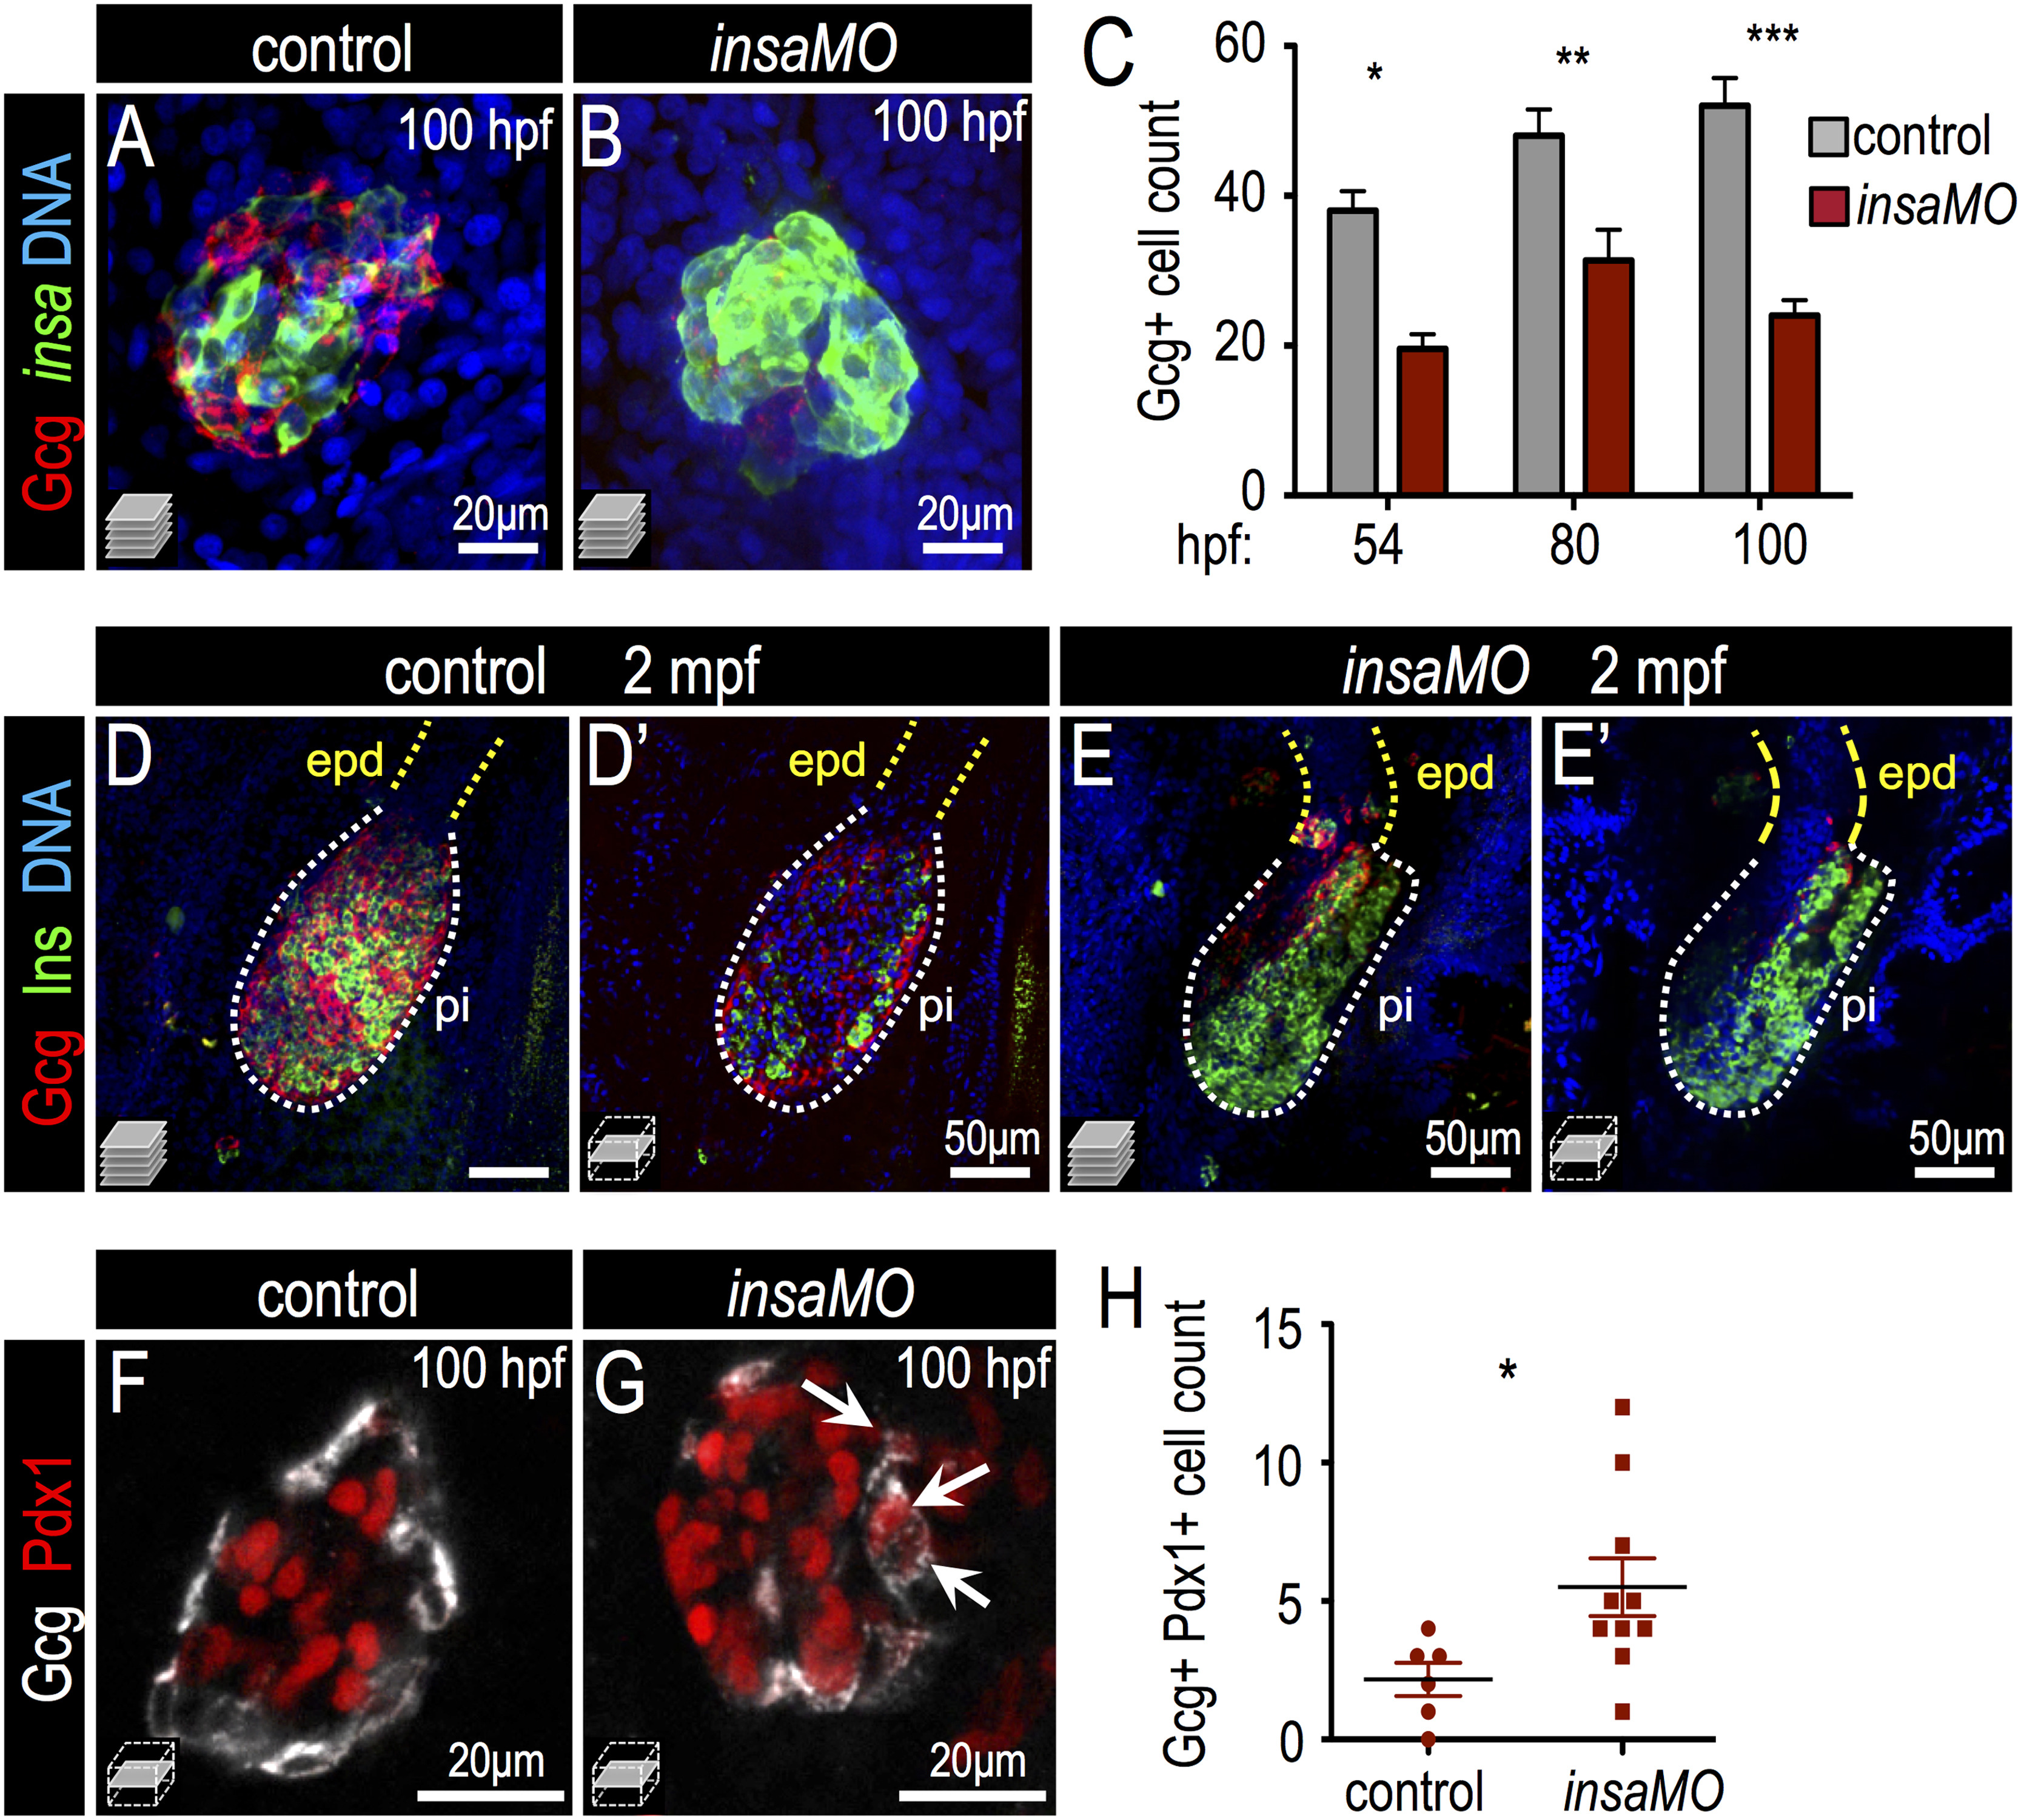
Fig. 5
Insulin knockdown impairs α cell development and destabilizes α cell fate. (A,B) Confocal projections of 100 hpf Tg(insa:CFP-NTR) control (A) and insaMO-injected (B) islets stained for Glucagon (red) and CFP (β cells, green). α cell count is decreased and α/beta; cell architecture is inverted. (C) Quantification of Glucagon-positive cells in 54 hpf, 80 hpf and 100 hpf control (gray) and insaMO-injected (red) islets (n ≥ 5 for all time points except 54 hpf control, n=3). (D–E′) Confocal projections (D,E) and confocal planes (D′,E′) of 2 months post fertilization (mpf) control (D,D′) and insaMO-injected (E,E′) islets stained for Glucagon (red), Insulin (green) and DNA (blue). Reduction of α cell mass was sustained into adult stages. (F,G) Confocal planes of 100 hpf control (F) and insaMO-injected (G) islets immunostained for Glucagon (white) and Pdx1 (red). Double positive Glucagon+ Pdx1+ cells (arrows) were increased with insaMO-injection. (H) Quantification of double positive Glucagon+ Pdx1+ cells in 100 hpf control (n=6) and insaMO-injected (n=10) islets. Two way ANOVA was used in C and Student′s t-test was used in H to determine significance.
Reprinted from Developmental Biology, 409(2), Ye, L., Robertson, M.A., Mastracci, T.L., Anderson, R.M., An insulin signaling feedback loop regulates pancreas progenitor cell differentiation during islet development and regeneration, 354-69, Copyright (2016) with permission from Elsevier. Full text @ Dev. Biol.