
- Title
-
Ovarian senescence increases liver fibrosis in humans and zebrafish with steatosis
- Authors
- Turola, E., Petta, S., Vanni, E., Milosa, F., Valenti, L., Critelli, R., Miele, L., Maccio, L., Calvaruso, V., Fracanzani, A.L., Bianchini, M., Raos, N., Bugianesi, E., Mercorella, S., Di Giovanni, M., Craxì, A., Fargion, S., Grieco, A., Cammà, C., Cotelli, F., Villa, E.
- Source
- Full text @ Dis. Model. Mech.
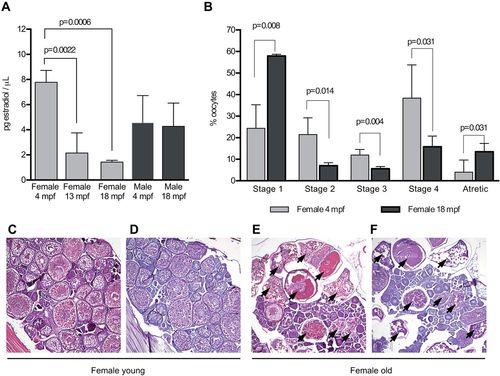
Definition of reproductive age in zebrafish. (A) Serum estradiol levels in female and male zebrafish during ageing. Data are reported as mean±s.d. Final sample number=12 per sex/age. (B) Application of the ovary maturation classification in the evaluation of the effects of ageing on zebrafish ovarian tissue (see supplementary material Fig. S1 for details). Three sections from five fish per subgroup were analyzed. Data were expressed as mean±s.d. H&E-stained (C,E) and PAS-stained (D,F) sections of the ovaries of young (4mpf) and old (18mpf) female zebrafish. Atretic follicles (indicated by arrows) were mostly found in old female fish with low to absent E2 levels. mpf, months post fertilization. |
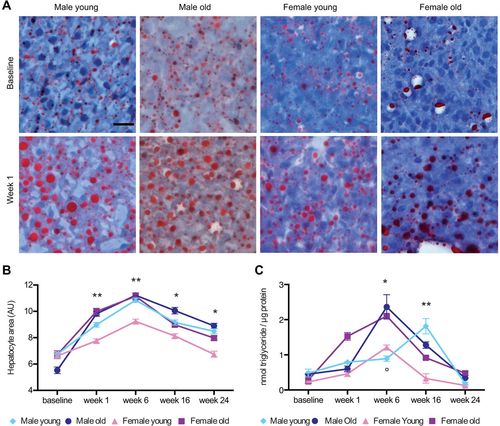
Hepatic steatosis in overfed zebrafish. (A) Oil Red O staining of liver sections from young males, old males, young females and old female zebrafish at baseline, and after 1week of overfeeding. Scale bar: 20µm. The percentage of the area stained by Oil Red O was quantified by using Image J (Schneider et al., 2012) in three sections from five fish per subgroups (supplementary material Fig. S3B). (B) To compare the development of steatosis between different groups, we measured, by using ImageJ (Schneider et al., 2012), the surface area of 30 randomly assigned hepatocytes in three sections from five different fish per subgroup, which had been stained with H&E (Kuroda et al., 2012). Values are expressed as means±s.e.m. The group of young females was compared with each of the other groups (*P<0.0001; **P<0.01). (C) Quantification of liver triglyceride in overfed zebrafish that had been grouped according to age and gender. Final sample number=6 per subgroup. Values are expressed as means±s.e.m. (*P<0.0001 young females vs old males and old females; °P=0.0049 young females vs young males; **P<0.0001, the group of young females was compared with each of the other groups). |
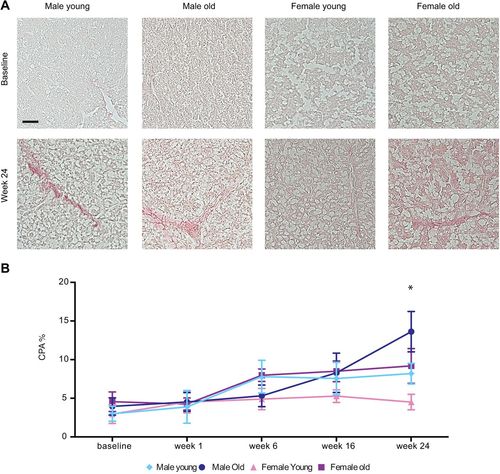
Assessment of hepatic fibrosis in overfed zebrafish. (A) Sirius Red staining of liver sections from young males, old males, young females and old female zebrafish at baseline, and after 24weeks of overfeeding. Scale bar: 30µm. (B) Quantification of liver fibrosis by using computer-assisted digital image analysis. Data are reported as collagen proportionate area (CPA) converted into a percentage. Three sections from five fish per subgroup were analyzed. Values are expressed as means±s.d. *P<0.0001 for young females versus all the other groups. |
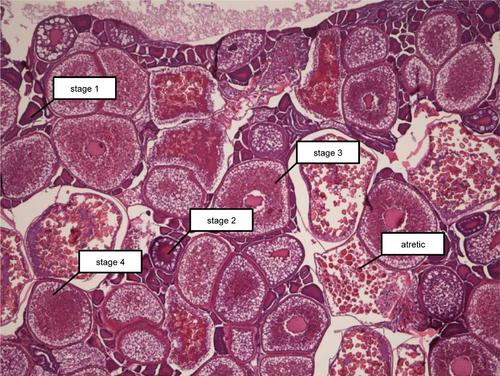
Developmental stages of the oocytes. Stage 1, perinucleolar oocytes. The oocytes size was small and ooplasm lacks granular structure. Stage 2, cortical alveolar oocytes. The vitelline envelope (zona radiata) begin to form. Stage 3, vitellogenic oocyte. The oocyte increased in size; the granular structures in ooplasm were larger and the nucleus was irregular in the shape. Stage 4, mature oocyte. The nucleus could not be observed due to the granular structures that filled up the entire cytoplas. Atretic stage. Oocyte and the vitelline membrane structure started to disintegrate. |
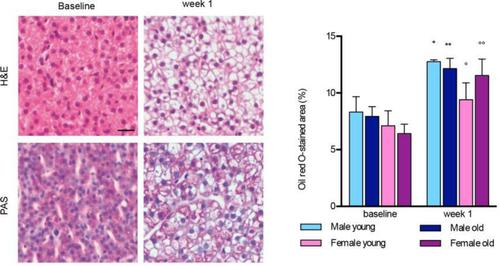
Hepatic steatosis in overfed zebrafish. (A) Representative H&E, and PAS staining of liver sections from controls (left) and overfed fish after 1 week of treatment (right). Both controls and treated animals were old male fish. Size bar 20 mm. (B) Quantitation of Oil red O stained area in liver sections from young males, old males, young females and old females zebrafish at baseline and after 1 week of overfeeding. The positive areas were measured with Image J (Schneider et al., 2012) and normalized on the total area of the section. The analysis has been carried out in three sections from 5 fish per subgroups. (* male young: p=0.033; ** male old: p=0.009; ° female young: p=0.283; °° female old: p=0.014; vs. respective baseline). |