
Fig. 2
- ID
- ZDB-FIG-151109-4
- Publication
- Turola et al., 2015 - Ovarian senescence increases liver fibrosis in humans and zebrafish with steatosis
- Other Figures
- All Figure Page
- Back to All Figure Page
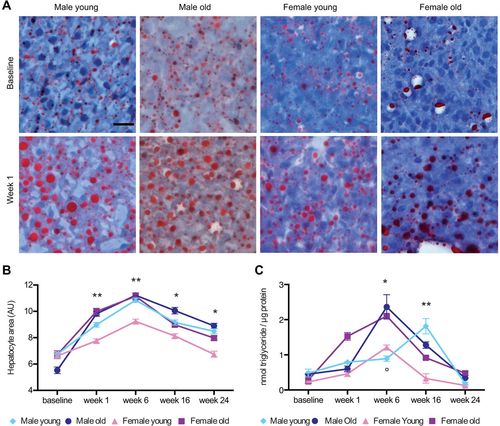
Hepatic steatosis in overfed zebrafish. (A) Oil Red O staining of liver sections from young males, old males, young females and old female zebrafish at baseline, and after 1week of overfeeding. Scale bar: 20µm. The percentage of the area stained by Oil Red O was quantified by using Image J (Schneider et al., 2012) in three sections from five fish per subgroups (supplementary material Fig. S3B). (B) To compare the development of steatosis between different groups, we measured, by using ImageJ (Schneider et al., 2012), the surface area of 30 randomly assigned hepatocytes in three sections from five different fish per subgroup, which had been stained with H&E (Kuroda et al., 2012). Values are expressed as means±s.e.m. The group of young females was compared with each of the other groups (*P<0.0001; **P<0.01). (C) Quantification of liver triglyceride in overfed zebrafish that had been grouped according to age and gender. Final sample number=6 per subgroup. Values are expressed as means±s.e.m. (*P<0.0001 young females vs old males and old females; °P=0.0049 young females vs young males; **P<0.0001, the group of young females was compared with each of the other groups). |