
- Title
-
Decreased thyroid hormone signaling accelerates the reinnervation of the optic tectum following optic nerve crush in adult zebrafish
- Authors
- Bhumika, S., Lemmens, K., Vancamp, P., Moons, L., Darras, V.M.
- Source
- Full text @ Mol. Cell Neurosci.
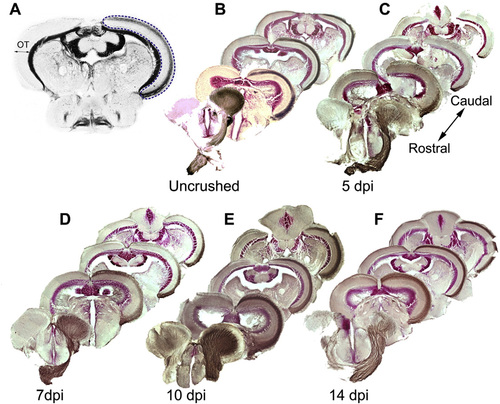
A. Selection of the white matter area of the optic tectum (OT, blue dotted line) for quantification of the biocytin signal. B–F. Innnervation of the OT by RGC axons in uninjured fish and reinnervation of the OT by regenerating RGC axons at 5, 7, 10 and 14 dpi. Brain sections are arranged from rostral to caudal, the side innervated by the crushed ON on the right. By 5 dpi biocytin labeled regenerating RGC axons (brown) started to enter the OT. At 7 dpi they arrived approximately halfway through the OT. At 10 and 14 dpi, the biocytin labeling matches that observed in uncrushed fish. |
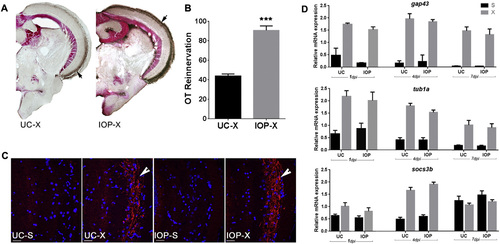
IOP treatment following ONC facilitates OT reinnervation. A. Reinnervation of the OT by RGC axons at 7 dpi in UC and IOP fish. Brown staining indicated with arrow represents biocytin labeled RGC axons. B. Quantification of the area covered by RGC axons in the OT of UC and IOP fish. Data represent mean ± SEM (n = 5 animals per group). ***p < 0.0001 by unpaired t-test. C. Immunofluorescent detection of Gap43 protein (red) in RGC axons (arrow) arriving in the OT. Cell nuclei are stained with DAPI (blue). Pictures are representative images for n = 5 animals/group. Scale bar 20 µm. D. Lowering intracellular TH availability did not affect the expression of regeneration associated genes in the retina. qPCR shows that the relative mRNA level of gap43, tuba1, and socs3b is significantly upregulated at 1, 4 and 7 dpi in both UC and IOP fish. Upregulation is however similar in both groups. Data represent mean ± SEM (n = 4 retina pools per group). For all panels: UC-untreated control, IOP—iopanoic acid treated, S—sham operated, X—optic nerve crushed, OT—optic tectum. |
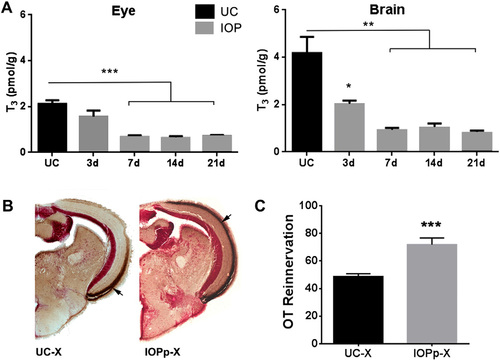
A. IOP treatment lowers T3 levels in the eye and brain. Data represent mean ± SEM of T3 concentrations (pmol/g tissue) in UC fish and fish treated with IOP for 3, 7, 14 and 21 days. (n = 4 tissue pools per group). *p < 0.05, **p < 0.005 and ***p < 0.0001 by unpaired t-test compared to UC. B. IOP treatment started 2 weeks prior to ONC also facilitates OT reinnervation. Pictures show reinnervation of the OT by RGC axons at 7 dpi in UC and IOPp fish. Brown staining indicated with arrow represents biocytin labeled RGC axons. C. Quantification of the area covered by RGC axons in the OT of UC and IOPp fish. Data represent mean ± SEM (n = 7–10 animals/group). ***p < 0.0001 by unpaired t-test. For all panels: UC—untreated control, IOPp—iopanoic acid pretreated for 2 weeks, X—optic nerve crushed, OT—optic tectum. For interpretation of the references to color in this figure legend, the reader is referred to the web version of this article. |
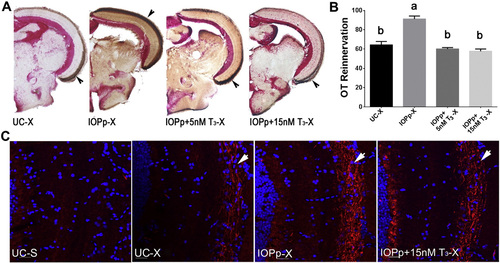
T3 supplementation attenuates OT reinnervation. A. Reinnervation of the OT by RGC axons at 7 dpi in different groups. Brown staining indicated with arrow represents biocytin labeled RGC axons. B. Quantification of the area covered by RGC axons in the OT of the different groups. Data represent mean ± SEM (n = 4–5 animals/group). Data were analyzed by ANOVA followed by Scheffé test. Means with a different letter (a–b) are significantly different (p at least < 0.05). C. Immunofluorescent detection of Gap43 protein (red) in RGC axons (arrow) arriving in the OT. Cell nuclei are stained with DAPI (blue). Pictures are representative images for n = 4–5 animals/group. Scale bar — 20 µm. For all panels: UC—untreated control, IOPp—iopanoic acid pretreated for 2 weeks, IOPp + 5nM T3 (or + 15 nM T3)-iopanoic acid pretreated for 2 weeks before crush and co-treated with 5 nM T3 (or 15 nM T3) starting 3 days before crush, S—sham operated, X—optic nerve crushed, OT—optic tectum. |
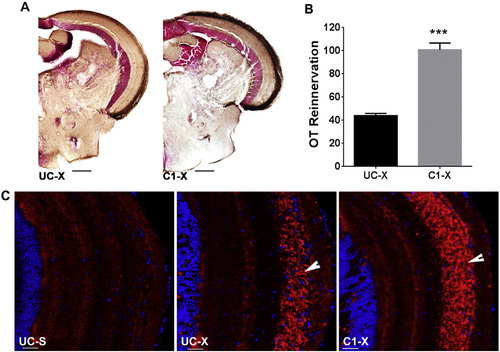
Blocking TRβ receptor accelerates OT reinnervation. A. Brown staining represents biocytin labeled RGC axons. B. Quantification of the area covered by RGC axons in the OT of UC and C1 fish. Data represent mean ± SEM (n = 6 animals/group). ***p < 0.0001 by unpaired t-test. C. Immunofluorescent detection of Gap43 protein (red) in RGC axons (arrow) arriving in the OT. Cell nuclei are stained with DAPI (blue). Pictures are representative images for n = 4 animals/group. Scale bar - 20 µm. For all panels: UC-untreated control, C1-compound 1 treated, S-sham operated, X-optic nerve crushed, OT-optic tectum. |
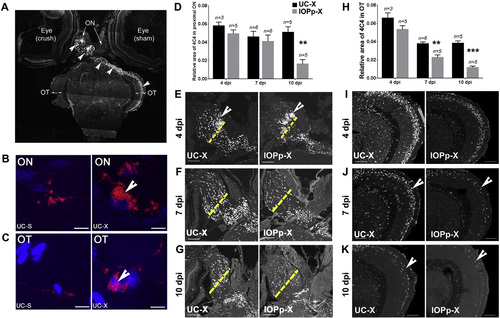
IOP treatment accelerates the resolution of microglia/macrophages in the ON and OT. A. Overview of the presence of inactive and reactive microglia/macrophages (arrow heads) after ONC in the injured ON and OT as detected with the 4C4 antibody. B–C. Magnification of the inactive ramified form (red) and the reactive amoeboid form of microglia/macrophages (red, arrowhead) in ON and OT of the sham operated and ONC side, respectively. Nuclei are stained with DAPI (blue). Scale bar — 5 µm. D. and H. Quantification of the area covered by the microglia/macrophages in the proximal ON and OT in UC and IOPp fish at 4, 7 and 10 dpi, respectively. Data represent mean ± SEM (n = 3–6 animals/group). **p < 0.005 and ***p < 0.0001 by unpaired t-test, compared to UC at the same time point. E.–G. and I.–K. Immunofluorescent detection of activated microglia/macrophages in the proximal ON and the OT at 4, 7 and 10 dpi. The site of crush is marked by a yellow dotted line. At 4 dpi microglia/macrophages are more densely packed in the proximal ON in the IOPp group compared to the UC group (indicated by arrowhead in panel E). At 7 and 10 dpi less microglia/macrophages are present in the OT of the IOPp group compared to the respective UC group (indicated by arrowheads in panels J and K). Scale bar — 100 µm. For all panels: UC—untreated control, IOPp—iopanoic acid pretreated for 2 weeks, S—sham operated optic nerve, X—optic nerve crushed, ON—optic nerve, OT—optic tectum. |
Reprinted from Molecular and cellular neurosciences, 68, Bhumika, S., Lemmens, K., Vancamp, P., Moons, L., Darras, V.M., Decreased thyroid hormone signaling accelerates the reinnervation of the optic tectum following optic nerve crush in adult zebrafish, 92-102, Copyright (2015) with permission from Elsevier. Full text @ Mol. Cell Neurosci.