
|
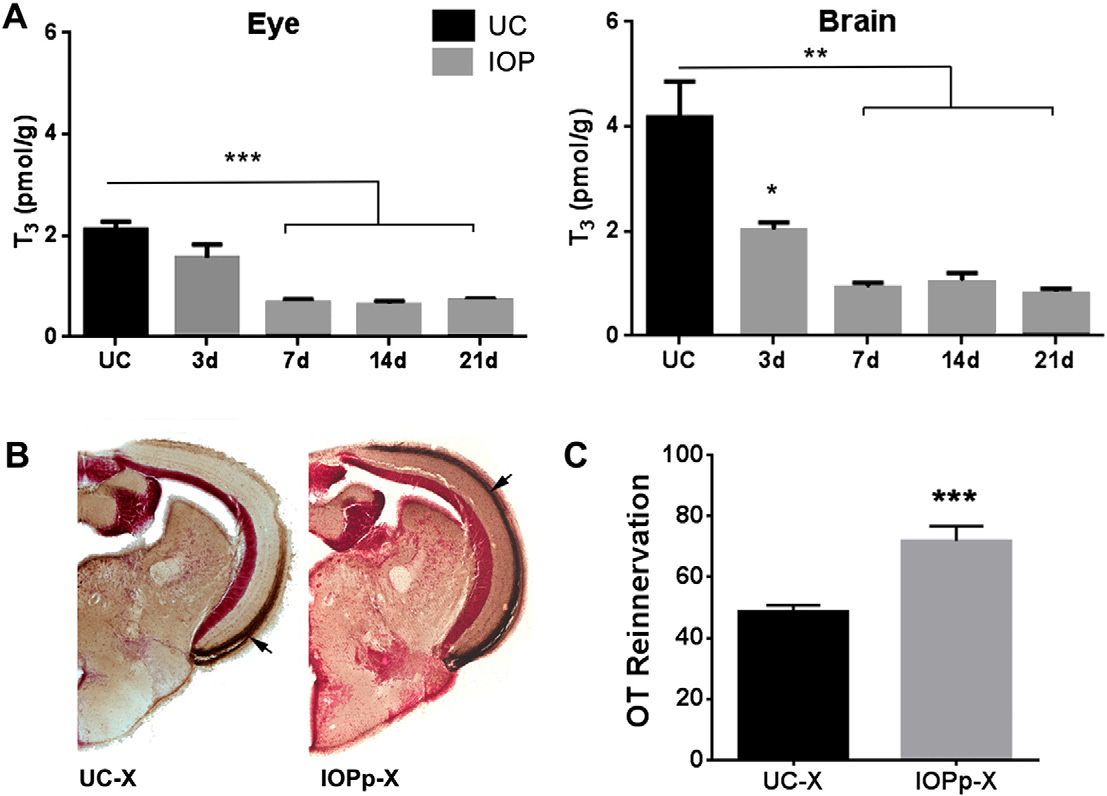
Fig. 3
A. IOP treatment lowers T3 levels in the eye and brain. Data represent mean ± SEM of T3 concentrations (pmol/g tissue) in UC fish and fish treated with IOP for 3, 7, 14 and 21 days. (n = 4 tissue pools per group). *p < 0.05, **p < 0.005 and ***p < 0.0001 by unpaired t-test compared to UC. B. IOP treatment started 2 weeks prior to ONC also facilitates OT reinnervation. Pictures show reinnervation of the OT by RGC axons at 7 dpi in UC and IOPp fish. Brown staining indicated with arrow represents biocytin labeled RGC axons. C. Quantification of the area covered by RGC axons in the OT of UC and IOPp fish. Data represent mean ± SEM (n = 7–10 animals/group). ***p < 0.0001 by unpaired t-test. For all panels: UC—untreated control, IOPp—iopanoic acid pretreated for 2 weeks, X—optic nerve crushed, OT—optic tectum. For interpretation of the references to color in this figure legend, the reader is referred to the web version of this article.
Reprinted from Molecular and cellular neurosciences, 68, Bhumika, S., Lemmens, K., Vancamp, P., Moons, L., Darras, V.M., Decreased thyroid hormone signaling accelerates the reinnervation of the optic tectum following optic nerve crush in adult zebrafish, 92-102, Copyright (2015) with permission from Elsevier. Full text @ Mol. Cell Neurosci.