
- Title
-
Fat-Dachsous Signaling Coordinates Cartilage Differentiation and Polarity during Craniofacial Development
- Authors
- Le Pabic, P., Ng, C., Schilling, T.F.
- Source
- Full text @ PLoS Genet.
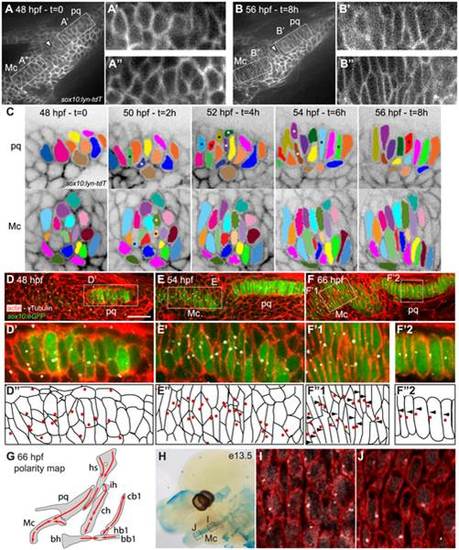
Morphogenesis and polarity of pharyngeal cartilages. (A–B): First (A) and last (B) time points of an 8 hour time-lapse movie of the first pharyngeal arch in a sox10:lyn-tdTomato transgenic, lateral view, anterior to the left. These frames show changes in cell shape and organization in presumptive palatoquadrate (pq) (A′ and B′) and Meckels (Mc) (A′′ and B′′) between 48 and 56 hpf. Arrowheads point to presumptive joint. (C). Color tracking of selected pq and Mc cells in the time lapse shown at 2 hour intervals. Asterisks denote medio-laterally intercalating cells. (D–G): Polarity dynamics during cartilage morphogenesis. Embryos stained for cortical actin with phalloidin (red) to reveal cell outlines, and anti-acetylated tubulin (white). (D) sox10:eGFP fluorescence first appears in differentiating chondrocytes of presumptive pq by 48 hpf, and in Mc by 54 hpf (E). (D′, D′′, E′, E′′) MTOCs of intercalating cells localize towards the center of the condensation. (F, F21, F′′1, F′2, F′′2) Stable cell arrangement and polarity patterns are achieved by 66 hpf. (G) Polarity map of cartilages in pharyngeal arches 1–3 at 66 hpf, illustrated in lateral view, anterior to the left. (H–J) Polarity pattern in the e13.5 mouse Mc. (H) Alcian Blue stained e13.5 mouse head showing regions of Mc assayed for polarity. (I) proximal Mc is polarized ventrally, while distal Mc is polarized dorsally (J). Scale bar = 21µl;m. Mc: Meckel′s; pq: palatoquadrate; PA: pharyngeal arch. Hm: hyosymplectic; ih: interhyal; ch: ceratohyal; bh: basihyal; cb1: ceratobranchial1; hb1: hypobranchial1; bb1: basibranchial. |

Quantification of differentiation, cell shape, cell orientation and cell polarity. (A) Cell length-width ratio (LWR) and orientation of longest cell axis were measured in pq to quantify cell stacking. Intracellular localization of microtubule organizing centers (MTOC) was recorded as readout of cell polarity. (B) LWR, cell orientation and polarity in WT zebrafish pq. (C) Polarity quantification in mouse proximal Mc. (D) LWR, cell orientation and polarity significantly differed (**) from WT values in all mutant and MO-treated embryos (p<0.001; Watson′s U2 test). (E–G) LWR, cell orientation and polarity significantly differed (**) between transplant side and control side (p<0.001; Watson′s U2 test). diff.: differentiation; c-side: control side. Mc: Meckel′s; pq: palatoquadrate. |

fat3, dchs2 and fjx1 are expressed in cartilage precursors. (A–F): In situ hybridization for fat3, dchs2 and fjx1. Lateral views, anterior to the left. fat3 (blue/black) is coexpressed with col2a1 (red) in presumptive cartilages at 54 hpf (A) and 60 hpf (B). dchs2 (C, D) and fjx1 (E, F) are also expressed in presumptive pharyngeal cartilages at 54 and 60 hpf. Scale bar = 54 µm. (G–H′): Fat3 protein localizes to the cell membrane but is more diffuse in prechondrocytes than in surrounding cells. (G–H): Two-channel images showing sox10:lyn-tdTomato membrane labeling (red) and anti-Fat3 signal (green). (G′-H′): Single-channel images showing anti-Fat3 signal alone. Scale bar = 21µm. Mc: Meckel′s; pq: palatoquadrate. |
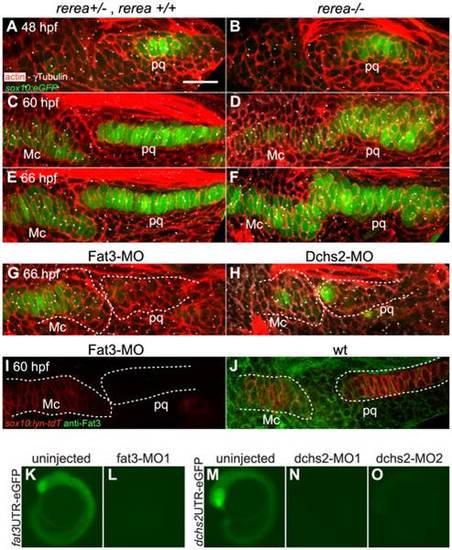
REREa, Fat3 and Dchs2 are required for cartilage stacking and polarity. (A–F): Abnormal stacking and polarity in rerea-/- embryos carrying the sox10:eGFP transgene (green) and stained for cortical actin with phalloidin (red) to reveal cell outlines. Lateral views, anterior to the left. (A, B) Stacking and polarity are comparable in rerea+/+, rerea+/- and rerea-/- pq at 48 hpf. (C, D) Stacking and polarity defects appear in rerea/ pq by 60 hpf, and persist at 66 hpf (E–F). (G, H): Abnormal differentiation, stacking and polarity in Fat3- (G) and Dchs2-deficient embryos (H). (I–J): Fat3-MO injection decreases Fat3 protein levels (loss of green in I) in comparison to WT levels (J). Scale bar = 21µm. (K–O) eGFP reporter RNAs – fat3 52UTR-eGFP (K,L) or dchs2 52UTR-eGFP (M–O) – were injected alone or together with either fat3-MO1 (L), dchs2-MO1 (N) or dchs2-MO2 (O), and eGFP fluorescence measured at 18–20 hpf. Views are lateral, with anterior to the left. Mc: Meckel′s; pq: palatoquadrate. |
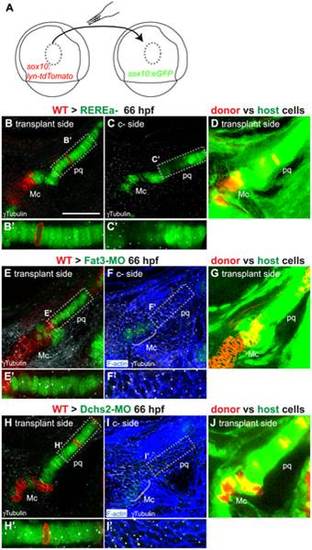
(A): presumptive CNC cells were transplanted from sox10:lyn-tdTomato- to sox10:eGFP transgenic embryos at the shield stage (B–D): WT transplants rescue cartilage stacking and polarity non-cell autonomously in rerea-/- embryos. Embryos stained for anti-acetylated tubulin (white). (B, B′) single confocal slice showing rescue of stacking and polarity in (rerea-/-; sox10:eGFP) mutant cells by a (WT; sox10:lyn-tdTomato) transplant. (C, C′) contralateral side without transplant. (D) Transplanted side with increased brightness in the green and red channels to show lineal contributions in non-cartilage cells. (E–J) Non cell-autonomous rescue of cartilage differentiation, stacking and polarity in (Fat3-MO; sox10:eGFP)(E, E′) or (Dchs2-MO; sox10:eGFP)(H, H′) embryos by (WT; sox10:lyn-tdTomato) transplants. (F, F′, I, I′) contralateral sides without transplants, stained for cortical actin with phalloidin (blue) to reveal cell outlines. (G, J) Transplanted side images with increased brightness in the green and red channels to show lineal contributions in non-cartilage cells. Scale bar = 50µm. Mc: Meckel′s; pq: palatoquadrate. |
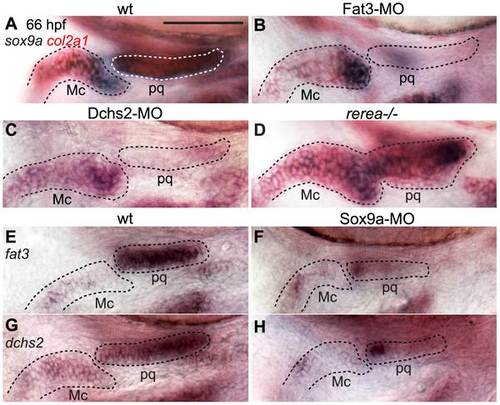
Regulatory feedback between Fat3, Dchs2, REREa and Sox9a. In situ hybridizations, lateral views, anterior to the left. (A–C) Reduction of sox9a/col2a1 expression in Fat3- (B) or Dchs2-deficient embryos (C) at 66 hpf. (D) Ectopic expression of sox9a/col2a1 in rerea-/- embryos at 66 hpf. (E–H) Reduction in Sox9a results in reduced fat3 (F) and dchs2 (H) expression. EXPRESSION / LABELING:
|
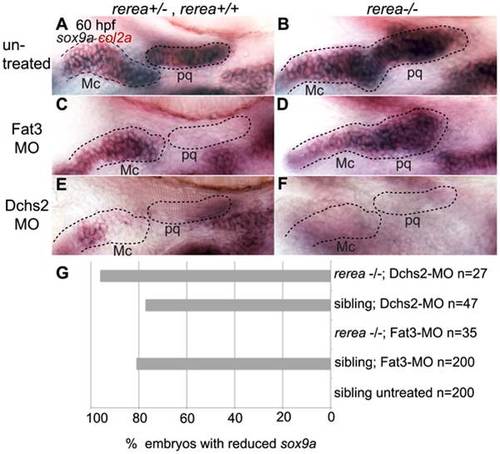
REREa interacts genetically with Fat3. (A, B) sox9a/col2a1 expression patterns in rerea+/+, rerea+/- (A) and rerea-/- (B) embryos. (C, D) Reduction in sox9a/col2a1 expression in Fat3-deficient embryos (C), but not in embryos deficient in both Fat3 and REREa (D). (E, F) Reduction in sox9a/col2a1 expression in Dchs2-deficient embryos (E) and embryos deficient in Dchs2 and REREa (F). (G) Quantification of the proportion of embryos with reduced sox9a/col2a1 expression. Scale bar = 54µm. Mc: Meckel′s; pq: palatoquadrate. EXPRESSION / LABELING:
|
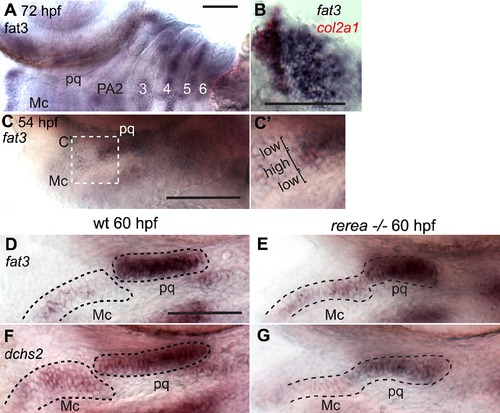
fat3 and dchs2 expression in WT and rerea-/- embryos. In situ hybridizations, lateral views, anterior to the left. (A) fat3 is expressed in presumptive cartilages of the posterior pharyngeal arches at 72 hpf, and expressed in the pectoral fin blade at 66 hpf (B). (C, C′) Lower levels of fat3 expression are also detected in cells surrounding the chondrogenic area. (D–G) fat3 (E) and dchs2 (G) are expressed in presumptive cartilages of rerea-/- embryos. Scale bar = 54 µm. Mc: Meckel′s; pq: palatoquadrate. EXPRESSION / LABELING:
|