
Fig. 3
|
Fig. 3
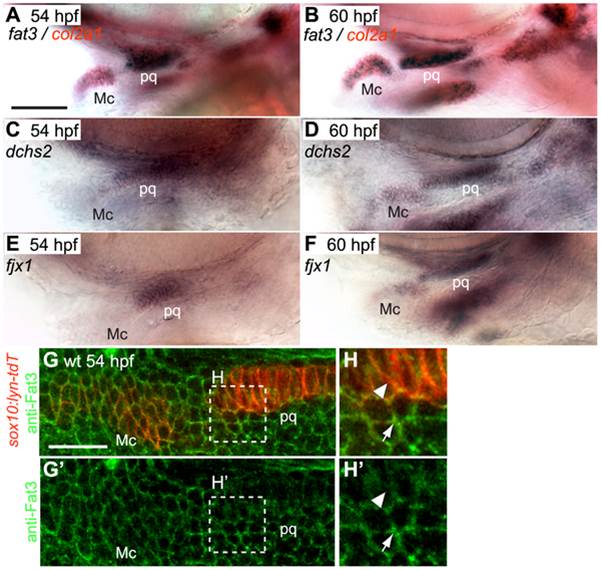
fat3, dchs2 and fjx1 are expressed in cartilage precursors.
(A–F): In situ hybridization for fat3, dchs2 and fjx1. Lateral views, anterior to the left. fat3 (blue/black) is coexpressed with col2a1 (red) in presumptive cartilages at 54 hpf (A) and 60 hpf (B). dchs2 (C, D) and fjx1 (E, F) are also expressed in presumptive pharyngeal cartilages at 54 and 60 hpf. Scale bar = 54 µm. (G–H′): Fat3 protein localizes to the cell membrane but is more diffuse in prechondrocytes than in surrounding cells. (G–H): Two-channel images showing sox10:lyn-tdTomato membrane labeling (red) and anti-Fat3 signal (green). (G′-H′): Single-channel images showing anti-Fat3 signal alone. Scale bar = 21µm. Mc: Meckel′s; pq: palatoquadrate.