
- Title
-
Zebrafish tbx5 paralogs demonstrate independent essential requirements in cardiac and pectoral fin development
- Authors
- Parrie, L.E., Renfrew, E.M., Vander Wal, A., Mueller, R.L., and Garrity, D.M.
- Source
- Full text @ Dev. Dyn.
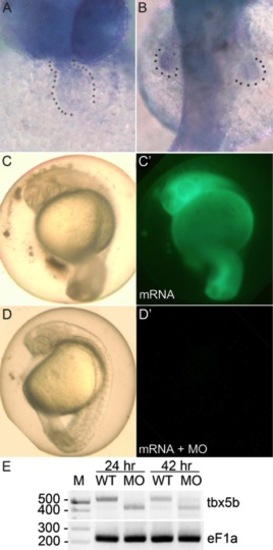
tbx5b expression and confirmation of morpholino knockdown using green fluorescent protein (GFP) -tagged mRNA containing the tbx5b morpholino (MO) target site or reverse transcriptase-polymerase chain reaction (RT-PCR). A,B: tbx5b in situ hybridization of 36 hpf embryos, showing (A) a ventral view with cardiac expression and (B) a dorsal view with signal in the pectoral fins. C,C′: The efficacy of tbx5b morpholino knockdown was confirmed using a Tester mRNA constructed by inserting the tbx5b MO target site in front of EGFP coding sequences. At 36 hpf, 100% of control embryos injected with 1,000 ng/μl Tester mRNA displayed normal body morphology and expressed GFP (n = 30). D,D′: Embryos co-injected with 100 μM morpholino and 1,000 ng/μl Tester mRNA displayed normal body axes and central nervous system development, but (D′) 87% failed to detectably express GFP (n = 30), indicating that the tbx5bMO efficiently targeted the expected binding site. E: RT-PCR–amplified RNA from buffer-injected control (wild-type [WT]) or tbx5bSD-MO (MO) injected embryos, with eF1a loading controls. Expected amplicon sizes are 513 bp for wild-type transcripts and 417 bp for transcripts lacking exon 2. M, marker. EXPRESSION / LABELING:
|
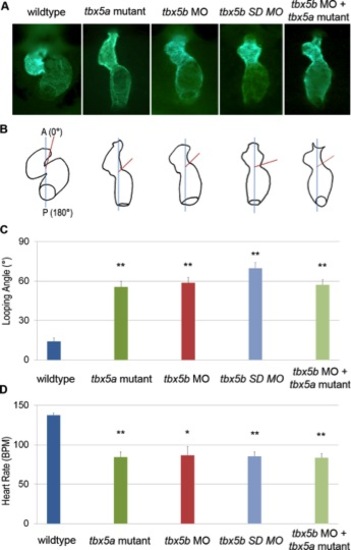
tbx5a mutants and tbx5b morphants display cardiac defects at 48 hours postfertilization (hpf). At 48 hpf, the looping angles (defined as the angle created between the plane of the cardiac atrioventricular junction [AVJ] and the embryo anteroposterior [A/P] axis) were determined for tbx5a mutants and tbx5b morphants. A: Representative green fluorescent protein (GFP) -expressing hearts imaged in the Tg(myl7:EGFP-HsHRAS) transgenic line (ventral views). B: Diagram of the looping angle as measured for the hearts in (A). C: The average looping angle determined from at least 14 embryos per genotype. D: Heart rates were measured at early chamber morphogenesis stage (42 hpf), chosen as the optimal time for balancing maximal cardiac function before end-stage degeneration. The average heart rate in beats per minute (BPM) for 42 hpf embryos is presented (at least 11 embryos per genotype). Relative to controls, the mutants and morphants exhibited a statistical difference of **P < 0.001, or *P < 0.01. (a= anterior, defined here as 0°, p = posterior of the embryo). |
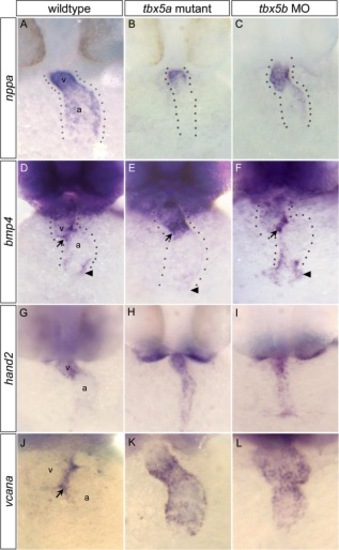
Differential expression of putative target genes in tbx5a mutants versus tbx5b morphants. A–C: At 36 hours postfertilization (hpf), expression of nppa (a conserved Tbx5 target) was reduced in the atrium of tbx5a mutant embryos, but expressed throughout both chambers in tbx5b morphant embryos, similar to controls. D–F: At 42 hpf, bmp4 was misexpressed throughout the ventricle of homozygous tbx5a mutant embryos. In tbx5b morphant embryos, bmp4 expression was similar to wild-type. G–I: At 42 hpf, soon after looping has begun, wild-type embryos primarily expressed hand2 in the ventricle, but tbx5a mutant and tbx5b morphant embryos showed expanded expression encompassing both chambers. J–L: At 42 hpf, wild-type embryos showed vcana expression restricted to atrioventricular junction (AVJ) boundary, but mutant and morphant embryos showed expanded expression throughout the ventricle and atrium. Arrows, AVJ boundary; arrowheads, sinus venosus. Dotted lines flank the cardiac tissue. EXPRESSION / LABELING:
|
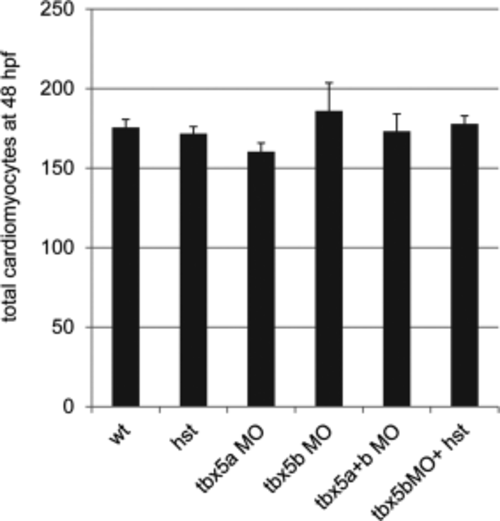
Cardiac cell number is not affected by the lack of functional Tbx5a or Tbx5b. Quantification of total cardiomyocyte numbers in wild-type (wt) and tbx5a or tbx5b-deficient embryos at 48 hours postfertilization (hpf). Data are expressed as means ± SE. There were no statistically significant differences among these treatments (*P > 0.05). For the columns listed left to right, n = 20, 11, 17, 11, 20, 14 embryos. PHENOTYPE:
|
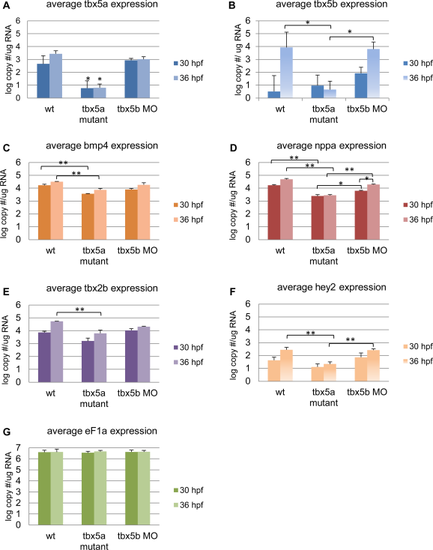
Loss of Tbx5a or Tbx5b differentially affects the expression of conserved mammalian Tbx5 target genes. mRNA levels for candidate target genes were quantified by qPCR. Data are represented as the mean ± S.E. Differences in expression, measured in log-transformed values of copy number per ug template RNA, were analyzed by ANOVA. A Tukey-Kramer post hoc test was used to determine statistical differences between samples (*P < 0.05, **P < 0.001). A,B: The zebrafish Tbx5 paralogs. C-F: Candidate direct targets of Tbx5 based on conservation among vertebrates. G: A house-keeping gene used as a standard control. |
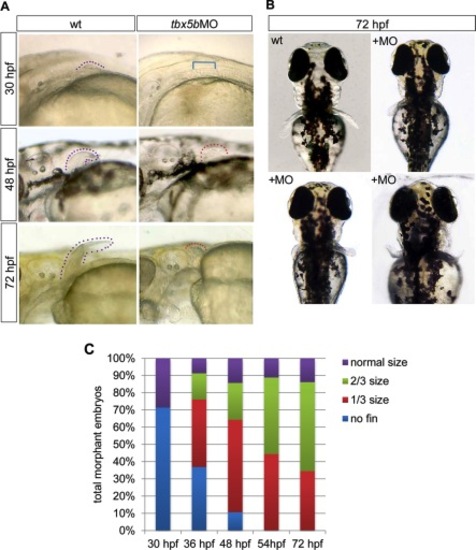
Depletion of tbx5b delays pectoral fin initiation and reduces fin outgrowth. A: Lateral brightfield images of pectoral fin area taken of control or tbx5bMO-injected embryos; anterior is oriented to the left. Arrowheads denote the tip of the pectoral fin and are color-coded based on size (see B). B: Dorsal brightfield images of wild-type (wt) and tbx5bMO injected embryos at 72 hours postfertilization (hpf) illustrating the variability observed in pectoral fin morphology among morphant embryos. C: Quantification of pectoral fin size for tbx5bMO-injected embryos as development progresses. n = 21–46 embryos per time point. Dotted lines flank the fin bud tissue; bracket indicates area with missing fin. PHENOTYPE:
|
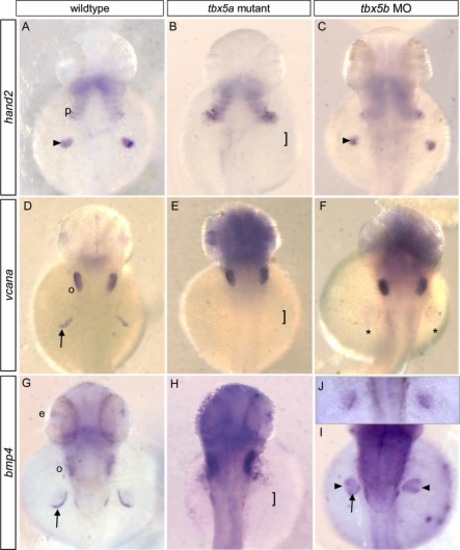
Differential phenotypes observed in fin differentiation for tbx5a mutants versus tbx5b morphants. A-J: Embryos at (A-C) 36 hpf; (D-F) 42 hpf; (G-I) 46 hpf; (J) 36 hpf. A: hand2 is expressed in mesenchyme of the wild-type fin bud. B: In tbx5a mutants, no pectoral fins develop; hand2 expression was absent in presumptive fin buds (brackets indicate region of expected expression) although present in pharyngeal arches. C: In tbx5b morphants, fin buds expressed hand2 in the mesenchyme in proportion to fin size. D: vcana expression in apical fold (AF) and otic placode (o). E: vcana expression missing in region of expected fin buds. F: vcana expression missing or barely detectable (*) in fin buds. G: bmp4 expression in eye, otic placode and AF of pectoral fin. H: No bmp4 expression in fin bud region. I: bmp4 expression can occur in AF (arrow); and was robustly detected in the mesenchyme of the fin bud. J: In younger embryos bmp4 was similarly detectable in mesenchyme and AF as it begins to form. AF, apical fold; e, eye; o, otic placode; p, pharyngeal arches; arrowhead, fin bud mesenchyme; arrow, AF; * barely detectable AF/mesenchyme expression; brackets, region of expected fin bud formation. |
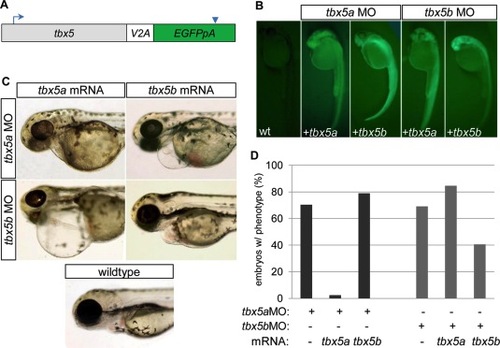
mRNA injection rescue studies indicate that tbx5a and tbx5b are not functionally redundant in cardiac development. A: Schematic of mRNA structure for rescue constructs, in which the coding sequence for tbx5a or tbx5b was connected to enhanced green fluorescent protein (EGFP, with accompanying poly-adenylation signal) by means of a viral 2A peptide. Blue arrow indicates location of translation start site. Blue arrowhead indicates termination signal. B: Fluorescent images of 26 hours postfertilization (hpf) embryos previously injected with combinations of either buffer (in wild-type, wt), tbx5aMO or tbx5bMO, and tbx5a or tbx5b mRNA to evaluate mRNA integrity by means of production of translated GFP. C: Brightfield images of 72 hpf embryos showing representative cardiac phenotypes for each group of injected embryos. D: Quantification of morpholino injected embryos displaying a cardiac morphology phenotype at 54 hpf. (tbx5aMO 70.3% n = 91; tbx5a MO+ tbx5a mRNA 2.4% n = 84; tbx5a MO+ tbx5b mRNA 78.9% n = 133; tbx5b MO 69.1% n = 220; tbx5b MO+ tbx5a mRNA 84.6% n = 65, tbx5b MO+ tbx5b mRNA 40.6% n = 69). PHENOTYPE:
|
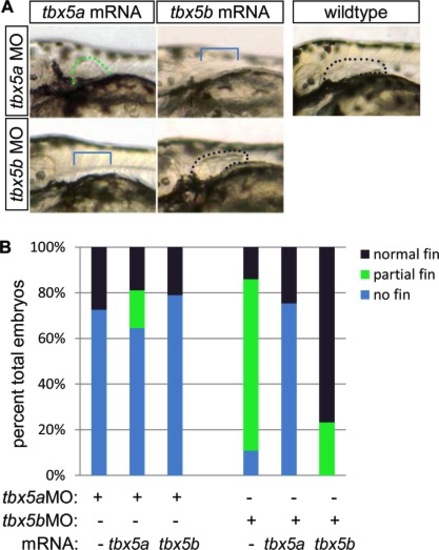
mRNA injection rescue studies indicate that tbx5a and tbx5b are not functionally redundant in pectoral fin bud outgrowth. A: Brightfield images of lateral pectoral fin region at 54 hours postfertilization (hpf). Dots outline the buds and are color-coded according to legend (see B). B: Percent of embryos exhibiting each phenotype (normal, partial or no pectoral fin outgrowth) at 54 hpf (tbx5a MO 82.5% n = 91; tbx5a MO+ tbx5a mRNA 78.6% n = 84; tbx5a MO+ tbx5b mRNA 89.5% n = 133; tbx5b MO 79.1% n = 220; tbx5b MO+ tbx5a mRNA n = 65, tbx5b MO+ tbx5b mRNA n = 69). Black or green dotted lines flank normal or truncated fin buds, respectively; bracket indicates area with missing fin. PHENOTYPE:
|