
- Title
-
Matrix metalloproteinase 14 in the zebrafish: an eye on retinal and retinotectal development
- Authors
- Janssens, E., Gaublomme, D., De Groef, L., Darras, V.M., Arckens, L., Delorme, N., Claes, F., Van Hove, I., and Moons, L.
- Source
- Full text @ PLoS One
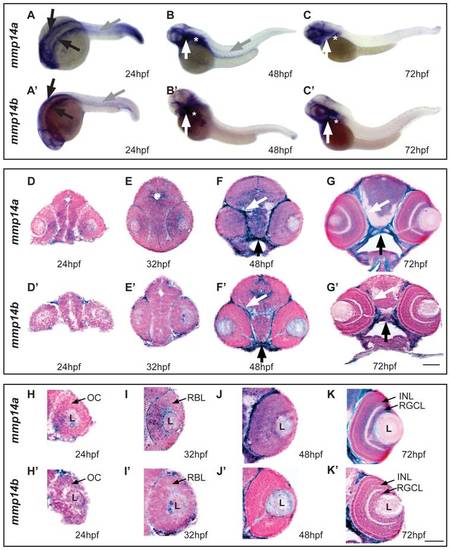
Spatiotemporal expression pattern of mmp14a and mmp14b mRNA in developing zebrafish. A-C & A′-C′ Whole mount in situ hybridization (ISH) for mmp14a (A-C) and mmp14b (A′-C′) in zebrafish embryos at various developmental stages shows mmp14a and mmp14b expression in the head mesenchyme lateral and ventro-lateral to the hindbrain (black arrows in A and A2) at 24 hpf, as well as in myosepta in the trunk and tail (grey arrow in A, B and A2) at 24 hpf and 48 hpf. Mmp14a and mmp14b expression in craniofacial elements (white arrow in B-C, B′-C′) and pectoral fins (white star in B-C, B′-C′) is apparent from 48 hpf onwards. D-G & D′-G′ Transverse sections through the head of zebrafish embryos, stained via whole mount ISH for mmp14a (D-G) and mmp14b (D2-G2) and counterstained with Nuclear Fast Red, show mRNA expression in the brain, cartilage (black arrow) and connective tissue (white arrow) at various developmental stages. H-K & H′-K′ Detailed view of the retina at various developmental stages shows prominent mmp14a expression in the optic cup (H) at 24 hpf, the retinoblast layer (I, J) at 32 and 48 hpf and in the INL and RGCL (K) at 72 hpf, while mmp14b expression in the retina is almost absent (H′-K′). hpf, hours post fertilization; INL, inner nuclear layer; L, lens; OC, optic cup; RBL, retinoblast layer; RGCL, retinal ganglion cell layer. Scale bars: 50 μm. EXPRESSION / LABELING:
|

Spatiotemporal expression pattern of MMP14 protein in developing zebrafish. A-E Immunohistochemical stainings on transverse sections, made through the head of zebrafish embryos of various developmental stages show MMP14 expression (red) in the retina and the brain from 32 hpf onwards (A). At 48 hpf and 72 hpf (B-D) expression is visible in the optic nerve (white arrowhead), in the POC and in the neuropil of the OT (D, E). Higher magnification of the eye at 72hpf (C) reveals MMP14 expression in the INL, IPL and RGCL as well as in the optic nerve. The inset in E gives a detailed view of the MMP14 positive tectal neuropil. DAPI (blue) was used as counterstain. hpf, hours post fertilization; INL, inner nuclear layer; IPL, inner plexiform layer; OT, optic tectum; POC, postoptic commissure; RGCL, retinal ganglion cell layer. Scale bars: 50 μm, except inset in panel E: 100 μm. EXPRESSION / LABELING:
|
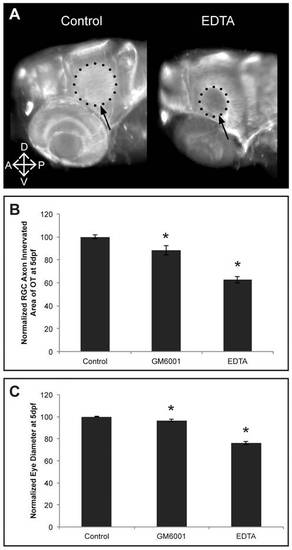
EDTA/GM6001 treatment results in microphthalmic embryos showing reduced RGC axon innervation in the optic tectum. A Whole mount immunostaining for acetylated-α-Tubulin in 5 dpf EDTA-treated embryos reveals a reduced tectal area (dotted circle and arrow) innervated by RGC axons, represented by the smaller dotted circle in the EDTA-treated embryos as compared to control embryos. Images show a dorsolateral view on the left OT and eye. B-C Quantitative analysis of the tectal area innervated by RGC axons and the eye size reveals that EDTA as well as GM6001 treatment leads to embryos with a significantly reduced RGC axon arborization area and microphthalmic eyes, as compared to control embryos at 5 dpf. Eye size and tectal innervation area are normalized to average values in untreated embryos (n = 30 from 3 independent experiments). Data are represented as mean ± SEM (*p<0.05, Student′s t-test). A; anterior; D, dorsal; dpf: days post fertilization; OT: optic tectum; P, posterior; RGC: retinal ganglion cells; V, ventral. |

Mmp14a knockdown minimally affects overall embryonic morphogenesis. A Knockdown of Mmp14a with 2 ng of Mmp14a-ATG MO at 3 dpf results in embryos with edema and a deformed body axis. However, embryos injected with 2 ng of both Mmp14a-ATG and p53 MOs do not show any morphological abnormalities. B Validation of Mmp14a-ATG MO efficiency via Western blotting using antibodies to zebrafish Mmp14a or to mouse MMP14, reveals reduced levels of active Mmp14a protein (60 kDa band) in 30 hpf Mmp14a morphants. Total protein coomassie blue staining was used for loading control. C RT-PCR analysis of Mmp14a-splice MO injected embryos reveals efficient splice blocking, resulting in a dose-dependent increase in aberrantly spliced mmp14a mRNA (345 bp band) and a concomitant decrease in correctly spliced mmp14a mRNA (168 bp band). D Semi-quantitative scoring of gastrulation defects at the tail bud stage (10 hpf) does not reveal a significant delay in gastrulation in Mmp14a morphant (Mmp14aKD) embryos, as compared to control embryos. The black arrowheads indicate the position of the germ cell layer (n = 141 from 3 independent experiments). E Measurements of the OVL, analysed by dividing EED by IED, in 31 hpf embryos, confirms the absence of a developmental delay after Mmp14a knockdown (n = 86 from 2 independent experiments). F Whole mount in situ hybridization for the neural markers dlx2, pax2.1 and shh shows normal development of the brain in control and Mmp14a morphant embryos at 32 hpf (n = 20 from 2 independent experiments). G Combined knockdown of Mmp14a and p53 (Mmp14aKD) only results in minor craniofacial abnormalities, including mild malformations of the Ceratohyal cartilage (white arrow) and the Meckel′s cartilage (black arrow) at 5 and 11 dpf. Left and middle panel are ventral views, the right panel is a lateral view. C, control; dpf, days post fertilization; EED, Eye-Ear-Diameter; IED, Inner-Ear-Diameter; hpf, hours post fertilization; MO, morpholino; OVL, Otic Vesicle Length. |
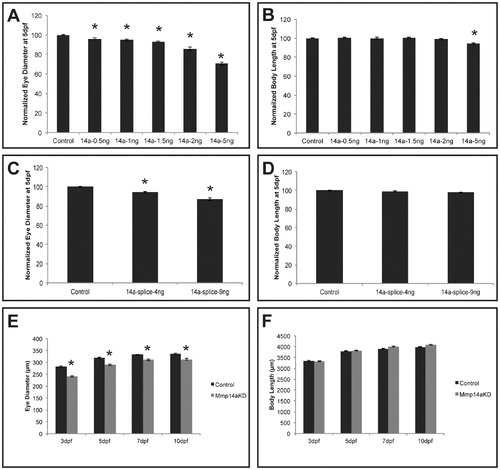
Mmp14a knockdown results in embryos with microphthalmic eyes. A-D Analysis of eye size (A, C) and total body length (B, D) reveals a dose-dependent decrease in eye size after knockdown of Mmp14a with the ATG- (A, B) or the splice MO (C, D) at 5 dpf. Body length, however, was only decreased after injection of a supramaximal dose of the Mmp14a-ATG MO (B) (n = 55 from 3 independent experiments). E, F Analysis of eye size (E) and total body length (F) (both in µm), in embryos injected with Mmp14a-ATG MO (Mmp14aKD), reveals that knockdown of Mmp14a leads to persistent microphthalmic eyes in embryos/larvae from 3 to 10 dpf while the overall body length is unaffected as compared to control fish (n = 75 from 3 independent experiments). Data are represented as mean ± SEM (*p<0.05, Student′s t-test for A-D; multilevel model statistical test (SAS proc mixed) for E-F). PHENOTYPE:
|
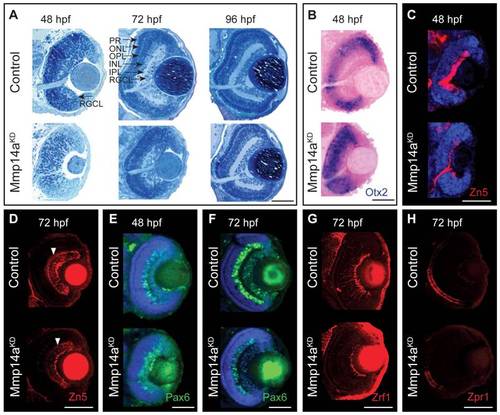
Mmp14a is required for timely differentiation of retinal neurons. A Toluidine blue stained transverse semi-thin sections show a delay in retinal differentiation and lamination in Mmp14a morphant eyes (Mmp14aKD). At 48 hpf, control embryos show an initial laminated retina, which develops into a fully laminated and differentiated retina at 72 hpf, with a clearly distinguishable RGCL, IPL, INL, OPL, ONL, and PR. Mmp14a morphant retinas, however, completely lack lamination at 48 hpf, while at 72 hpf the degree of lamination is still severely reduced, as compared to control embryos. At 96 hpf, however, morphant retinas appear fully laminated and differentiated and are indistinguishable from control retinas. B In situ hybridization for otx2 shows increased expression in the central retina of transverse eye sections of morphant embryos as compared to controls. Nuclear Fast Red was used as counterstain. C–H Immunohistochemical stainings for markers of neuronal differentiation on transverse sections of Mmp14a morphant and control embryos reveal a reduced expression of Zn5 (red), which stains RGCs and their axons, in Mmp14a morphants at 48 hpf (C) and 72 hpf (D, white arrowhead shows RGC dendrites), of Pax6 (green), which labels RGCs and amacrine cells, at 48 hpf (E) and 72 hpf (F), of the Müller glia marker Zrf1 (red) (G), and of the photoreceptor marker Zpr1 (red) (H), both at 72 hpf, all indicative for a disrupted retinal differentiation. DAPI (blue) was used as counterstain in C, E, F. The images in panel D, G and H were taken using confocal microscopy. hpf, hours post fertilization; INL, inner nuclear layer; IPL, inner plexiform layer; ONL, outer nuclear layer; OPL, outer plexiform layer; PR: photoreceptor layer; RGCL, retinal ganglion cell layer. Scale bars: 50 μm. EXPRESSION / LABELING:
|
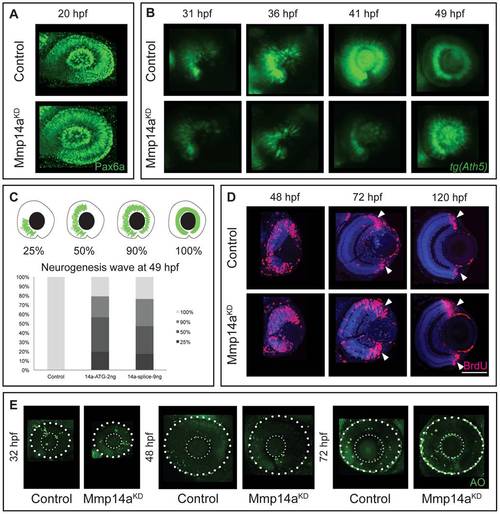
Mmp14a knockdown affects neurogenesis in the retina. A Whole mount immunostaining for Pax6a does not reveal any differences in eye morphology and Pax6a expression between Mmp14a morphant and control retinas at 20 hpf. B Live imaging of retinal neurogenesis in transgenic Tg(Ath5:GFP) embryos shows a small patch of Ath5+ cells in the ventronasal region of the developing eye in control embryos at 31 hpf. The Ath5+ cell population expands in a wave and reaches the ventrotemporal region of the retina around 41 hpf. Mmp14a morphant eyes show a delay in neurogenesis and the Ath5+ cell population only reaches the ventrotemporal region of the retina around 49 hpf. C The progression of the expansion of the Ath5+ cell population at 49 hpf is semi-quantitatively scored as illustrated in the top scheme. Injection of both the Mmp14a-ATG and the Mmp14a-splice MOs resulted in a severe delay of the neurogenesis wave (n = 45 from 3 independent experiments). D BrdU incorporation assays, performed at various developmental stages, show a higher number of immunopositive BrdU (BrdU+) cells in transverse sections of morphant retinas at 48 hpf. At 72 hpf, the proliferating region is restricted to the CMZ (white arrowhead) in control retinas, whereas BrdU+ cells are still abundantly detected in the central retina of Mmp14a morphant eyes. Even at 120 hpf, the proliferating region in morphant retinas is less confined to the CMZ as compared to control retinas. DAPI (blue) was used as counterstain. E Labeling of apoptosis using the fluorescent marker acridine orange does not reveal significant differences in the number of apoptotic cells at various developmental stages between Mmp14a morphant and control retinas. The small dotted circle marks the lens, the larger circle lines the eye (n = 20 from 4 independent experiments). AO, acridine orange; CMZ, cilliary marginal zone; hpf, hours post fertilization. Scale bar in D: 50 μm. EXPRESSION / LABELING:
|
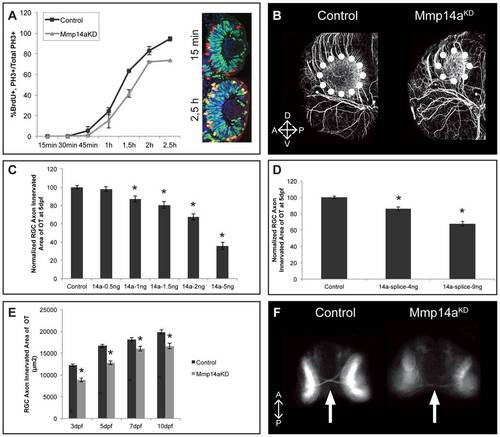
Mmp14a knockdown results in an impaired retinotectal development. A Graphical representation of the PLM from 15 minutes to 2.5 hours post-BrdU exposure at 31 hpf. The number of PH3+/BrdU+ retinoblasts is lower in retinas of Mmp14a morphant embryos as compared to control embryos, indicative for an impaired/prolonged transition from S to M phase at all time points examined (n = 10 from 2 independent experiments). Inset shows retinas of control embryos immunostained for BrdU (green) and PH3 staining (red) at 15 min and 2.5 h post-BrdU exposure. S-phase cells that have progressed from S to M phase are PH3+/BrdU+ (yellow). B Whole mount immunostaining for acetylated-α-Tubulin in 3 dpf embryos reveals a reduced tectal neuropil area (dotted circle), indicative for a reduced innervation of the OT by RGC axons. Images show a dorsolateral view of the left OT. C-D Quantitative analysis of the tectal area innervated by RGC axons reveals a dose-dependent decrease after Mmp14a knockdown using both the Mmp14a-ATG MO (C) and the Mmp14a-splice MO (D), as compared to control embryos at 5 dpf (n = 55 from 3 independent experiments). E Quantitative analysis of the tectal area innervated by RGC axons (in μm2) at different time-points between 3 and 10 dpf shows a significant and persistent reduction in RGC axon arborization area in Mmp14a morphant embryos as compared to controls (n = 55 from 3 independent experiments). F Knockdown of Mmp14a results in thinner optic nerves in 2 dpf transgenic Tg(Ath5:GFP) embryos, as compared to control embryos. Images show a ventral view on the optic chiasm (marked by white arrow). Data are represented as mean ± SEM (*p<0.05, Student′s t-test for C-D, multilevel model statistical test (SAS proc mixed) for A, E). A, anterior; dpf: days post fertilization; D, dorsal; OT: optic tectum; PLM, percent labeled mitosis; P, posterior; RGC: retinal ganglion cells; V, ventral. |
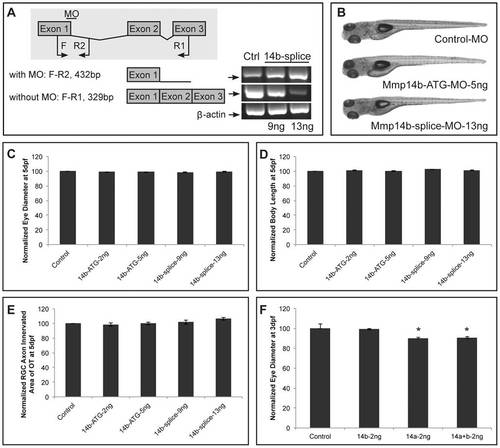
Mmp14b is not involved in retinal development. A RT-PCR analysis of Mmp14b-splice MO-injected embryos reveals efficient splice blocking, resulting in a dose-dependent increase in aberrantly spliced mmp14b mRNA. Since the splice MO targets intron 1 of mmp14b, which is 11 kb large, 2 different primer sets were used to visualize the splice blocking. Primer set F-R1 generates a fragment spanning exon 1 to 3 to detect correctly spliced transcripts (329 bp), and primer set F-R2 generates a fragment that spans exon 1 and part of intron 1 to detect aberrantly spliced transcripts (432 bp). The house keeping gene β-actin was used as a loading control. B Mmp14b knockdown using either the Mmp14b-ATG MO (5 ng) or the Mmp14b-splice MO (13 ng) in combination with the p53 MO does not affect normal embryonic morphogenesis at 5 dpf. C-E Quantitative analysis of eye size (C), total body length (D) and tectal area innervated by RGC axons (E) at 5 dpf, shows a normal eye diameter and tectal arborization area in Mmp14b morphant embryos using both the Mmp14b-ATG MO and Mmp14b-splice MO as compared to control embryos (n = 65 from 3 independent experiments)., F Combined knockdown of Mmp14a and Mmp14b (both injected at 2 ng) does not aggravate the eye defects observed after single Mmp14a knockdown in 3 dpf embryos (n = 70 from 3 independent experiments). Data are represented as mean ± SEM (*p<0.05, Student′s t-test). Dpf, days post fertilization; F, forward; MO, morpholino; R, reverse. PHENOTYPE:
|
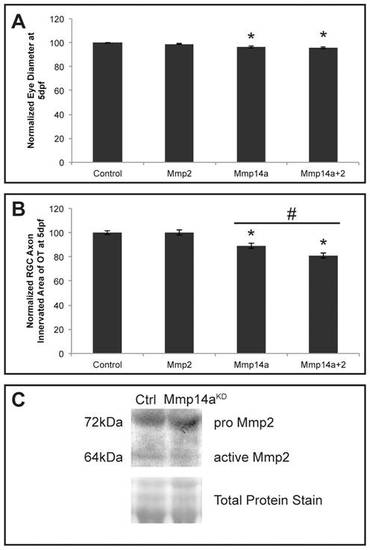
In vivo interaction between Mmp14a and Mmp2. A, B Quantitative analysis of eye size (A) and tectal area innervated by RGC axons (B) after single or combined suboptimal knockdown of Mmp14a and Mmp2 in 5 dpf embryos reveals that suboptimal knockdown of Mmp2 does not affect eye size nor OT innervation. However, combined knockdown of Mmp14a and Mmp2 results in embryos with normal eye size but a significantly reduced RGC axon innervation area in the OT, as compared to the Mmp14a suboptimal knockdown embryos (n = 75 from 3 independent experiments). C Western blot for Mmp2 on extracts of control and Mmp14a morphant embryos at 30 hpf shows reduced levels of active Mmp2 protein (64 kDa) in Mmp14a morphant embryos. Total protein coomassie blue staining was used for loading control. Data are represented as mean ± SEM (*p<0.05 versus controls using a Student′s t-test; #p<0.05 between 1 ng injections of Mmp14a-MO and Mmp14a+Mmp2-MO using a multilevel model statistical test (SAS proc mixed)). dpf: days post fertilization; hpf: hours post fertilization; MO: morpholino; OT: optic tectum; RGC: retinal ganglion cells. PHENOTYPE:
|
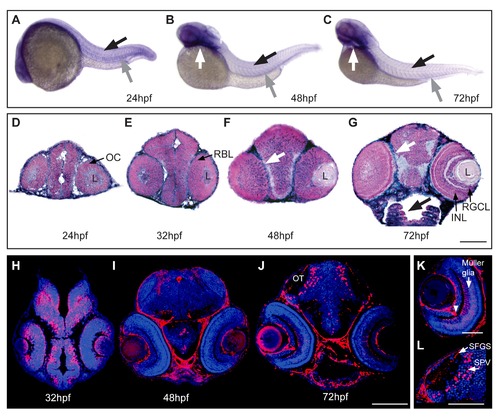
Spatiotemporal expression pattern of Mmp2 in developing zebrafish. A–C Whole mount in situ hybridization (ISH) for mmp2 in zebrafish embryos at various developmental stages shows mmp2 mRNA expression in the head, in myosepta (black arrow in A–C) and major blood vessels (grey arrow in A–C) in the tail at 24, 48 and 72 hpf. Mmp2 expressing craniofacial elements (white arrow in B and C) are visible from 48 hpf onwards. D–G Transverse sections through the head of zebrafish embryos, stained via whole mount ISH for mmp2 and counterstained with Nuclear Fast Red, show mmp2 expression in the brain and retina from 24 hpf onwards, in connective tissue (white arrow) from 32 hpf and in cartilage (black arrow) at 48 and 72 hpf. H–L Immunohistochemical stainings on transverse sections, made through the head of zebrafish embryos of various developmental stages, reveal Mmp2 protein expression (red) in the retina and the brain from 32 hpf onwards. Connective tissue and cartilage is labeled at 48 and 72 hpf. A higher magnification of the eye shows Mmp2 expression in Müller glia (white arrow) and their end feet and in the optic nerve head (white arrowhead) (K). A detailed view of the OT reveals Mmp2 expression in interneurons in the SPV and in their connections in the SFGS layer of the tectal neuropil (L). DAPI (blue) was used as counterstain. hpf, hours post fertilization; OT, optic tectum; SFGS, stratum fibrosum et grisum superficiale; SPV, stratum periventriculare. Scale bars: 50 μm, except panel L: 100 μm. EXPRESSION / LABELING:
|
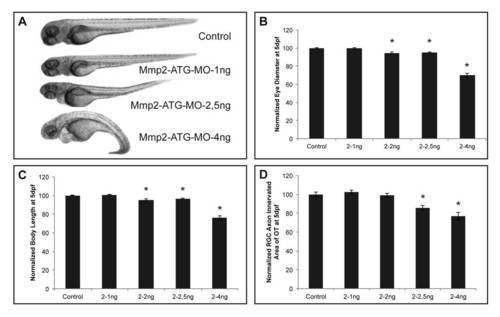
Mmp2 knockdown results in embryos with severe developmental defects. A Knockdown of Mmp2, obtained after injection of 1 ng of both Mmp2-ATG and p53 MOs, does not affect normal embryonic morphogenesis in Mmp2 morphants at 3 dpf, as compared to control embryos. However, embryos injected with 2.5 ng–4 ng of both Mmp2-ATG and p53 MOs show edema and a deformed body axis. B–D Analysis of eye size (B), total body length (C), and tectal area innervated by RGC axons (D) reveals a significant and dose-dependent decrease in eye size, tectal innervation area but also body length, after knockdown of Mmp2 with the ATG MO in 5 dpf morphants, as compared to control embryos (n = 45 from 2 independent experiments). A MO concentration of 1 ng does not affect any of these parameters and results in normally developing embryos. Eye size, body length and tectal innervation area are normalized towards average values in control embryos. Data are represented as mean ± SEM (*p-value<0.05, Student′s t-test). dpf, days post fertilization; MO, morpholino; OT, optic tectum; RGC, retinal ganglion cell. PHENOTYPE:
|

Unillustrated author statements EXPRESSION / LABELING:
|