
Fig. 8
- ID
- ZDB-FIG-130218-31
- Publication
- Janssens et al., 2013 - Matrix metalloproteinase 14 in the zebrafish: an eye on retinal and retinotectal development
- Other Figures
- All Figure Page
- Back to All Figure Page
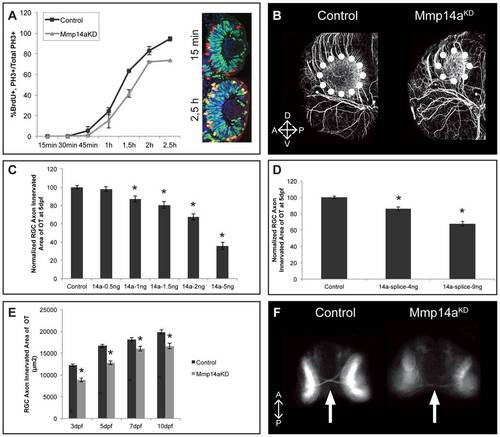
Mmp14a knockdown results in an impaired retinotectal development. A Graphical representation of the PLM from 15 minutes to 2.5 hours post-BrdU exposure at 31 hpf. The number of PH3+/BrdU+ retinoblasts is lower in retinas of Mmp14a morphant embryos as compared to control embryos, indicative for an impaired/prolonged transition from S to M phase at all time points examined (n = 10 from 2 independent experiments). Inset shows retinas of control embryos immunostained for BrdU (green) and PH3 staining (red) at 15 min and 2.5 h post-BrdU exposure. S-phase cells that have progressed from S to M phase are PH3+/BrdU+ (yellow). B Whole mount immunostaining for acetylated-α-Tubulin in 3 dpf embryos reveals a reduced tectal neuropil area (dotted circle), indicative for a reduced innervation of the OT by RGC axons. Images show a dorsolateral view of the left OT. C-D Quantitative analysis of the tectal area innervated by RGC axons reveals a dose-dependent decrease after Mmp14a knockdown using both the Mmp14a-ATG MO (C) and the Mmp14a-splice MO (D), as compared to control embryos at 5 dpf (n = 55 from 3 independent experiments). E Quantitative analysis of the tectal area innervated by RGC axons (in μm2) at different time-points between 3 and 10 dpf shows a significant and persistent reduction in RGC axon arborization area in Mmp14a morphant embryos as compared to controls (n = 55 from 3 independent experiments). F Knockdown of Mmp14a results in thinner optic nerves in 2 dpf transgenic Tg(Ath5:GFP) embryos, as compared to control embryos. Images show a ventral view on the optic chiasm (marked by white arrow). Data are represented as mean ± SEM (*p<0.05, Student′s t-test for C-D, multilevel model statistical test (SAS proc mixed) for A, E). A, anterior; dpf: days post fertilization; D, dorsal; OT: optic tectum; PLM, percent labeled mitosis; P, posterior; RGC: retinal ganglion cells; V, ventral. |
| Fish: | |
|---|---|
| Knockdown Reagents: | |
| Observed In: | |
| Stage Range: | Long-pec to Days 7-13 |