
- Title
-
Zebrafish agr2 is required for terminal differentiation of intestinal goblet cells
- Authors
- Chen, Y.C., Lu, Y.F., Li, I.C., and Hwang, S.P.
- Source
- Full text @ PLoS One
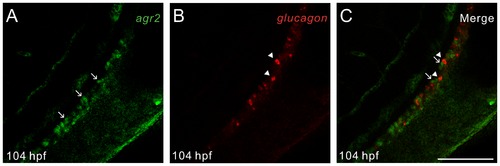
Zebrafish agr2 is solely expressed in intestinal goblet cells. Fluorescent whole-mount double in situ hybridization was conducted on 104-hours post fertilization (hpf) embryos using agr2 (green) and glucagon (red) as RNA probes. Confocal images were recorded using excitation/emission wavelengths of 494/517 nm for fluorescein (A) and 550/570 nm for cyanine 3 (B). Merged image is shown (C). Arrows indicate agr2-expressing goblet cells and arrowheads specify glucagon-expressing enteroendocrine cells. Scale bars represent 100 μm. EXPRESSION / LABELING:
|
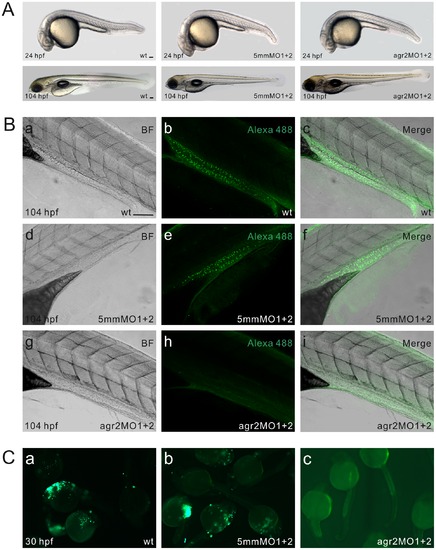
agr2 morpholino antisense oligomer knockdown analyses. (A) Phenotype comparison among wild type, agr2–5 mmMO1 and 5 mmMO2-coinjected, and agr2-MO1 and agr2-MO2-coinjected embryos at 24 and 104 hpf. (B) Whole-mount immunohistochemistry demonstrates that coinjection of agr2-MO1 and agr2-MO2 prevents the synthesis of Agr2 protein in intestinal goblet cells. Confocal images of either wild type, agr2–5 mmMO1 and 5 mmMO2-coinjected, or agr2-MO1 and agr2-MO2-coinjected 104 hpf embryos were recorded under transmitted mode (a, d, g) or using 494/517 nm excitation/emission wavelengths (b, e, h). Merged images are shown (c, f, i). (C) Green fluorescence was not detected in agr2-MO1, agr2-MO2 and CMV-agr2-mo-GFP coinjected (c) 30 hpf embryos, whereas bright green fluorescence was observed in CMV-agr2-mo-GFP-injected (a) and agr2–5 mmMO1, agr2–5 mmMO2 and CMV-agr2-mo-GFP coinjected (b) 30 hpf embryos. Scale bars represent 100 μm. |
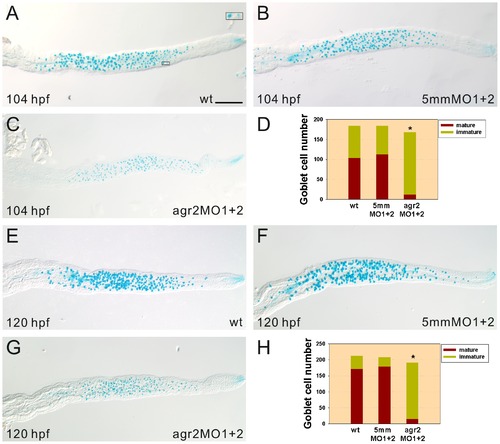
Terminal differentiation of intestinal goblet cells is affected in agr2 morphants. Significant increases in immature Alcian blue-stained goblet cell numbers were detected in 104- (C, n = 46) and 120-hpf (G, n = 23) agr2 morphants compared to those in either 104- (A, n = 40) and 120-hpf (E, n = 30) wild type or in 104- (B, n = 41) and 120-hpf (F, n = 27) agr2–5 mmMO1 and 5 mmMO2-coinjected embryos. Inset shows a mature and an immature goblet cell. Comparison of both immature and mature goblet cell numbers among agr2 morphants, wild type or agr2–5 mmMO1 and 5 mmMO2-coinjected embryos at 104 and 120 hpf are shown (D, H). A Student′s t-test was conducted to compare immature goblet cell numbers in agr2 morphants with those in wild type or agr2–5 mmMO1 and 5 mmMO2-coinjected embryos. *p<0.001. Scale bars represent 100 μm. |
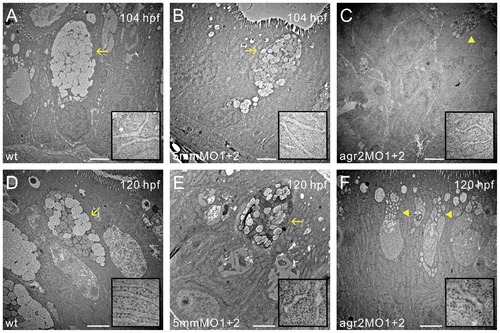
Transmission electron microscopy shows abnormal goblet cell structures in agr2 morphants. Mid-intestinal images of 104- and 120-hpf wild type (A, D), agr2–5 mmMO1 and 5 mmMO2-coinjected (B, E), and agr2 morphants (C, F) are shown. ER ultrastructure at higher magnification is shown in insets. Arrows indicate mature goblet cells and arrowheads denote immature goblet cells. Scale bars represent 2 μm. |
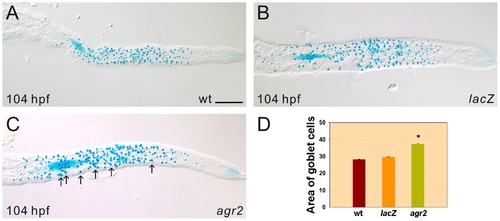
Enlarged areas of mature Alcian-blue stained goblet cells are detected in agr2-overexpressed embryos. Substantially increased areas of mature Alcian blue-stained intestinal goblet cells in 42% 104-hpf agr2-overexpressed (C, n = 29) embryos compared to lacZ-overexpressed (B, n = 20) embryos and wild type (A, n = 18) embryos were observed. Comparison of the area of Alcian blue-stained goblet cells in wild type, agr2- and lacZ-overexpressed embryos is shown (D). Arrows indicate examples of Alcian-blue stained goblet cells with enlarged areas. Student′s t-test was conducted and *p<0.001. Scale bars represent 100 μm. |
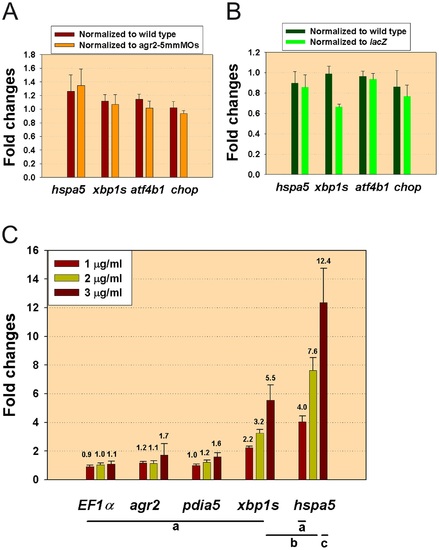
agr2 expression is not induced by tunicamycin treatment and perturbation of agr2 level does not induce ER stress. (A) Expression level of members of the UPR pathway (hspa5, xbp1s, atf4b1, chop) was not altered in agr2 morphants when normalized to wild type or to agr2-5 mmMO1 and 5 mmMO2-coinjected 104-hpf embryos by qPCR. (B) Expression of members of the UPR pathway (hspa5, xbp1s, atf4b1, chop) was not altered in agr2-overexpressed 104-hpf embryos when normalized to wild type or to lacZ-overexpressed embryos by qPCR. (C) agr2 expression level was not significantly induced upon 3 µg/ml tunicamycin treatment by qPCR. One-way analysis of variance and Tukey′s honestly significant different method (T-method) were conducted among different genes after treatment with different concentrations of tunicamycin [27]. Different letters (a, b, c) indicate a statistically significant difference (p<0.05). Average gene expression in fold changes for respective gene is indicated. Error bars indicate the standard error. |
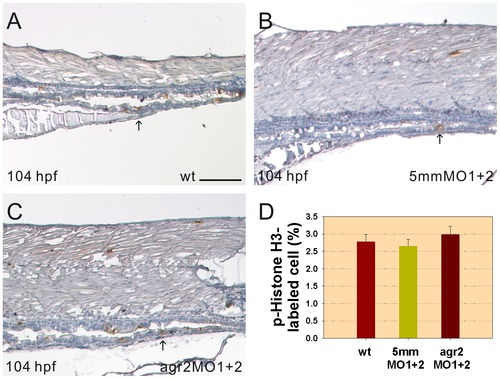
Intestinal cell proliferation is not altered in agr2 morphants. Images of p-Histone H3-stained cells in the mid-intestines and posterior intestines of 104-hpf wild type embryos (A), agr2–5 mmMO1 and 5 mmMO2-coinjected embryos (B) and agr2 morphants (C) are shown. Arrows indicate p-Histone H3-stained cells. (D) Comparison of the percentages of p-Histone H3-stained M phase cells among wild type embryos, agr2–5 mmMO1 and 5 mmMO2-coinjected embryos, and agr2 morphants is shown. Error bars indicate the standard error. Scale bars represent 100 μm. PHENOTYPE:
|