
- Title
-
Fgf signaling controls pharyngeal taste bud formation through miR-200 and Delta-Notch activity
- Authors
- Kapsimali, M., Kaushik, A.L., Gibon, G., Dirian, L., Ernest, S., and Rosa, F.M.
- Source
- Full text @ Development
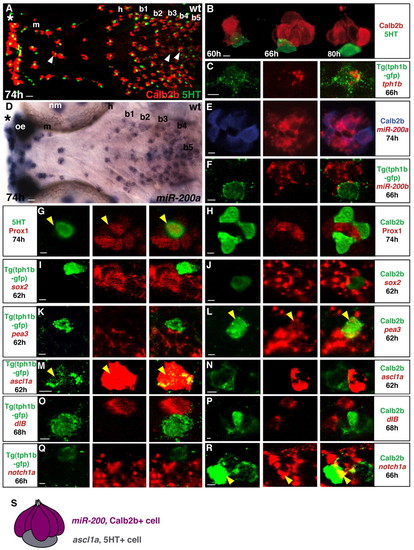
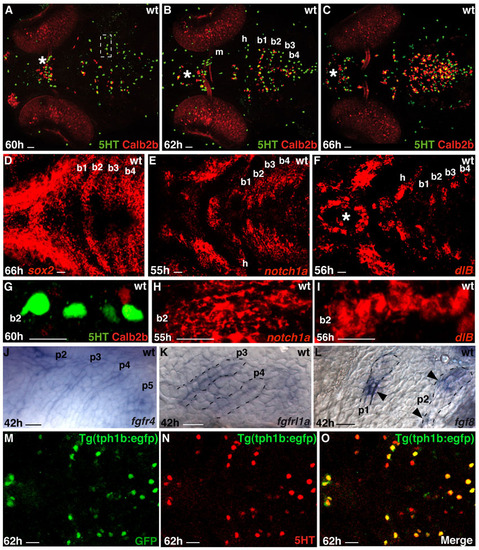
Taste buds are patterned in the zebrafish oropharynx and composed of distinct cell types. Marker expression in developing taste buds. Experimental conditions are indicated in the top right-hand corner, embryonic stage and scale bar are in the bottom left-hand corner and marker expression is in the bottom right-hand corner or on the left or right. Anterior is towards the left. (A,D) Ventral views of whole-mount zebrafish larvae heads showing taste bud cells expressing Calb2b (A, red), 5HT (A, green) or miR-200a (D, blue). Asterisks indicate the row of taste buds localized in the lips. Arrowheads in A indicate palate taste buds. Scale bar: 10 μm. (B) Confocal images showing the shape of the developing taste bud organ. (C) Optical section (1 μm) showing co-expression (yellow) of tph1b mRNA and GFP expression in Tg(tph1b:egfp) larva. (E-R) Optical sections (0.5-1.5 μm) showing the relationship between Calb2b, 5HT or Tg(tph1b:egfp) and other taste bud marker expression. Yellow arrowheads indicate marker co-expression in a single cell. (E) Most miR-200a (red) cells express Calb2b (blue). Scale bars: 2 μm. (S) The main markers discriminating Calb2b+ (purple) and 5HT+ (gray) cells. b1-b5, branchial arches 1-5; h, hyoid arch; m, mandibular arch; nm, neuromast; oe, olfactory epithelium. EXPRESSION / LABELING:
|
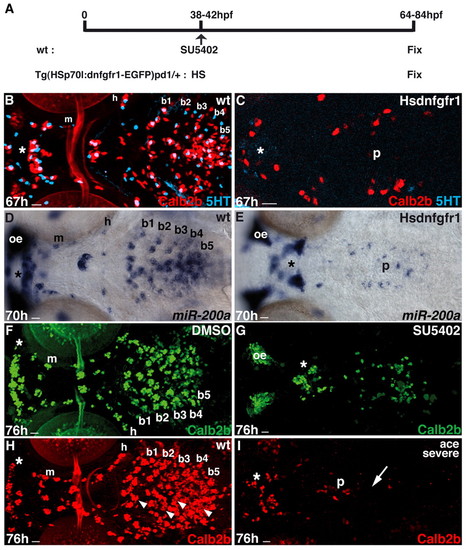
Taste bud development requires Fgf signaling. (A) Heatshock and SU5402 treatments in tg(hsp70l:dnfgfr1-EGFP)pd1/+ and wild-type embryos, respectively. (B-I) Ventral views of whole-mounted larvae heads. Asterisks indicate taste buds in the lips. Experimental conditions are indicated in the top right-hand corner, embryonic stage and scale bar are in the bottom left-hand corner and marker expression is in the bottom right-hand corner. Anterior is towards the left. (B-E) Calb2b (B,C, red), 5HT (B,C, cyan) and miR-200a (D,E, blue) expression in control (B,D) and Hsdnfgfr1+ (C,E) larvae after heatshock. (F,G) Wild-type immunostained for Calb2b after DMSO (F) and SU5402 (G) treatment, respectively. (H,I) Wild-type and ace–/– siblings (severe phenotype, for mild see Fig. S3A-D in the supplementary material) immunostained for Calb2b with strong reduction (arrow) of taste bud cells. Arrowheads in H indicate the palate (p) taste buds. Scale bars: 10 μm. b1-b5, branchial arches 1-5; h, hyoid arch; m, mandibular arch; oe, olfactory epithelium. EXPRESSION / LABELING:
PHENOTYPE:
|
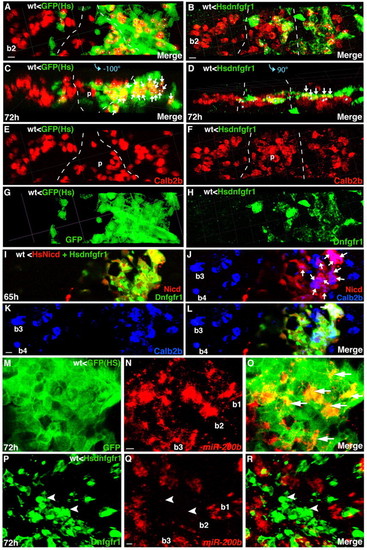
Fgf signaling is required within the pharyngeal endoderm for Calb2b+ cell formation. Experimental conditions are indicated in the top left- or right-hand corner, embryonic stage and scale bar are in the bottom left-hand corner and marker expression is in the bottom right-hand corner. Anterior is towards the top. Arrows indicate colocalization, arrowheads indicate exclusive marker expression. (A-L) Embryos from the same experiment. Scale bars: 5 μm. (A-H) Overlays (A-D) and single-color projections (E-H) of pharyngeal endodermal (Tar*) grafted cells (in wild type) that express GFP or Hsdnfgfr1 after heatshock. Broken lines mark the palate (p) cells. (C,D) Rotated 3D reconstructions of the views shown in A,B (–100°, +90°, respectively). In A-D, white dots are landmarks of individual cells with potential colocalization of tracer/Hsdnfgfr1 (green) and Calb2b (red). In A,C, almost all cells (17/20 dots) in branchial arch 2 (b2), co-express GFP and Calb2b (arrows, orange/yellow). By contrast, in B,D, only 5/15 cells (arrows, yellow) co-express Dnfgfr1 and Calb2b in b2. See also another example in Fig. S4E-G in the supplementary material. (I-L) Activation of Notch signaling restores Calb2b+ cell formation in pharyngeal epithelium with compromised Fgfr signaling. Confocal projection of pharyngeal endodermal (Tar*) grafted cells (in wild type) that express HsNicd (I,J,L, red/orange), Hsdnfgfr1 (I,L, green/orange) and Calb2b (J-L, blue/purple/cyan). (L) Superimposition of I,K. Arrows in J indicate cells with HsNicd and Calb2b co-expression. b3-b4, branchial arches 3-4. (M-O) Optical sections (2.5 μm); (P-R) confocal projection through pharyngeal endodermal (Tar*) grafted cells (in wild type) that express GFP (M-O, green) or Dnfgfr1 (P-R, green) and miR-200b (red) after heatshock. (O,R) Superimposition of M,N (O) and P,Q (R). GFP and miR-200b are co-expressed in many cells of several taste buds (arrows, yellow/orange), whereas miR-200b is absent from most Dnfgfr1+ cells (arrowheads) in b2. Scale bars: 4 μm. See also Fig. S4H-J in the supplementary material. |
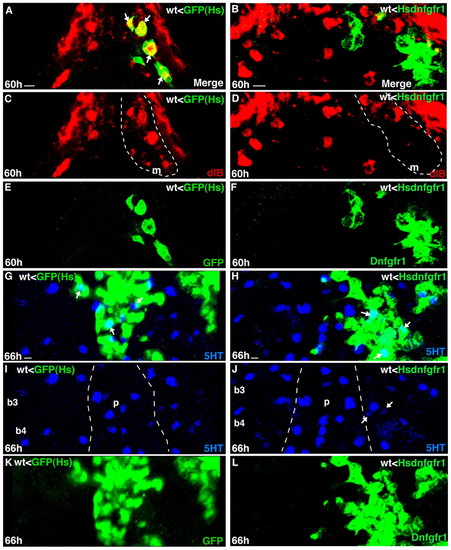
Fgf signaling is necessary within the pharyngeal endoderm for dlb expression, but is not required for 5HT expression in taste buds. Experimental conditions are indicated in the top right-hand corner, embryonic stage and scale bar are in the bottom left-hand corner and marker expression is in the bottom right-hand corner. Ventral views, anterior is towards the top. Arrows indicate marker co-expression in a single cell. Scale bars: 5 μm. (A-E) Optical sections (A,C,E) (2 μm) and asymmetric confocal projections (B,D,F) through pharyngeal endodermal (Tar*) grafted cells (in wild type) that express dlb (red) and GFP or Dnfgfr1 (green), after heatshock. dlb taste bud-related expression in the mandibular arch (m) is within the broken lines. Most GFP cells in the control graft co-express dlb (A, arrows); by contrast, most Dnfgfr1 cells are devoid of dlb expression (B, green). (G-L) Confocal projections through pharyngeal endodermal (Tar*) grafted cells (in wild type) that express 5HT (blue) and GFP or Dnfgfr1 (green) after heatshock. Broken lines mark the palate (p). |
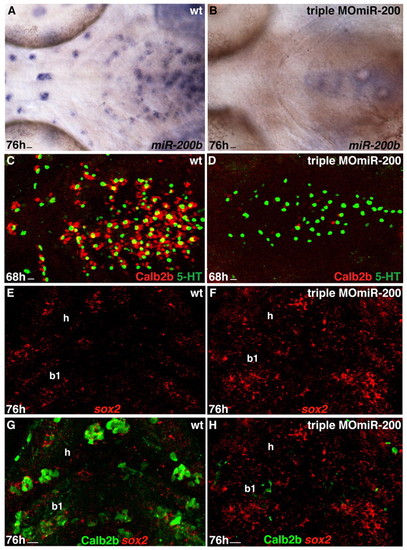
miR-200 knockdown results in reduction of taste bud cells. Experimental conditions are indicated in the top right-hand corner, embryonic stage and scale bar are in the bottom left-hand corner and marker expression is in the bottom right-hand corner. Anterior is towards the left. Scale bars: 8 μm. (A,B) Whole-mount ventral views of wild-type and triple MOmiR-200-injected embryo labeled with miR-200b probe. miR-200b expression is absent from the pharyngeal epithelium of the morpholino-injected embryo. (C,D) Whole-mount ventral views of taste buds of wild-type and triple MOmiR-200-injected embryo labeled with anti-Calb2b (red) and anti-5HT (green). Note the strong and mild reduction in the numbers of Calb2b+ and 5HT+ cells, respectively in the triple MOmiR-200 injected embryo (D) compared with the wild-type control. (E-H) Ventral view, anterior towards the top. Confocal projection of hyoid (h) and first branchial arch (b1) epithelium of a wild-type and a triple MOmiR-200 injected embryo labeled with the sox2 probe (E-H) and anti-Calb2b (G,H). Calb2b expression is severely decreased but sox2 expression is increased in the triple MOmiR-200 injected embryo (F,H) compared with the control (E,G). EXPRESSION / LABELING:
PHENOTYPE:
|
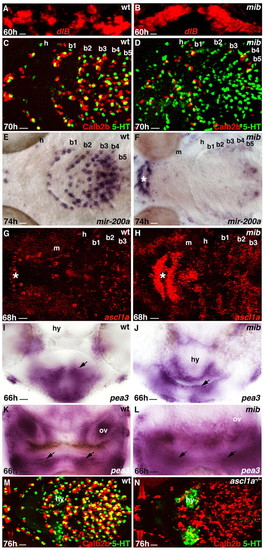
Delta and ascl1a activity are necessary for intact taste bud organ formation. Genotypes are indicated in the top right-hand corner, embryonic stage and scale bar are in the bottom left-hand corner and marker expression is in the bottom right-hand corner. (A,B) Anterior is towards the top. Ventral confocal projections of the first branchial arch showing dlb overexpression in mib–/– (B) compared with the wild-type sibling (A). (C-H,M,N) Anterior is towards the left. Ventral views. Asterisks in F-H indicate taste buds in the lips. 5HT+ and ascl1a-expressing cells are increased in number (D,H) and Calb2b+ and miR-200a-expressing cells reduced in number (D,F) in mib–/– compared with the wild type (C,G and C,E, respectively). By contrast, 5HT+ (green) cells are absent and Calb2b+ (red) cells disorganized in the ascl1a–/– pharynx (N) compared with the wild type (M). (I-L) Transverse sections of wild-type (I,K) and mib–/– siblings (J,L) labeled with the pea3 probe. Arrows indicate pea3 expression in the pharyngeal arch epithelium (I,J, hyoid; K,L, b4). Scale bars: 15 μm. b1-b5, branchial arches 1-5; h, hyoid arch; m, mandibular arch; ov, otic vesicle; hy, hypothalamus. EXPRESSION / LABELING:
PHENOTYPE:
|
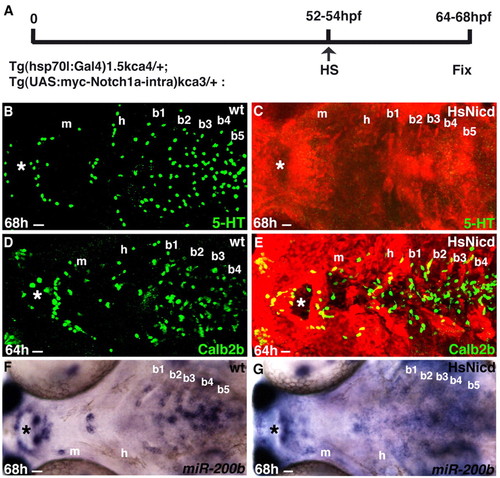
Activation of Notch signaling maintains taste bud Calb2b+ but not 5HT+ cells. (A) Heatshock treatment in HsNicd siblings. (B-G) Embryonic stage and scale bar are in the bottom left-hand corner and marker expression is in the bottom right-hand corner. Anterior is towards the left. Ventral views of whole-mounted larvae heads. Asterisks indicate taste buds in the lips. Note the absence of 5HT (C) and maintenance of Calb2b (E) and miR-200b (G) expression in the Hsnicd-expressing embryos compared with wild-type (heatshocked) siblings. Hsnicd embryos were identified by anti-myc (red, C,E) immunohistochemistry or genotyped after in situ hybridization (G). Scale bars: 12 μm. b1-b5, branchial arches 1-5; e, eye; h, hyoid arch; m, mandibular arch; nm, neuromast; oe, olfactory epithelium. |
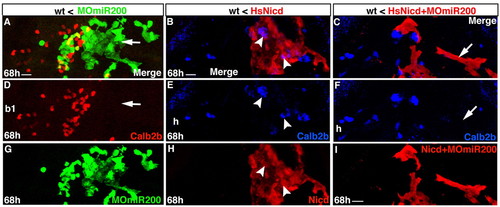
Activation of Notch signaling does not restore Calb2b+ cell formation in pharyngeal epithelium after miR-200 knock-down. Experimental conditions are indicated in the top right-hand corner, embryonic stage and scale bar are in the bottom left-hand corner and marker expression is in the bottom right-hand corner or in attached insets. Anterior is towards the top. Ventral views. Scale bars: 10 μm. (A,D,G) Confocal projections of grafted endodermal (Tar*) cells (in wild type) expressing triple MOmiR-200 (green) and Calb2b (red/yellow). The arrow indicates a severe reduction in Calb2b+ cell number in the triple MOmiR-200-expressing branchial arch epithelium (b1). (B,E,H) Confocal projections of grafted endodermal (Tar*) cells (in wild type) expressing HsNicd (red) and Calb2b (blue/purple). Arrowheads indicate Calb2b+ cells in the HsNicd hyoid epithelium (h). (C,F,I) Confocal projections of grafted endodermal (Tar*) cells (in wild type) co-expressing HsNicd, triple MOmiR-200 (red) and Calb2b (blue). The arrow indicates the absence of Calb2b+ cells in the HsNicd and triple MOmiR-200-expressing (red) hyoid epithelium (h). |
Expression patterns of taste bud and oropharyngeal epithelium markers. Scale bars: 10 μm. (A-C) Ventral views of larval heads showing the progressive increase in taste bud cells labelled with anti-5HT (green) and anti-Calb2b (red). (D-F) Horizontal optical sections (15 μm, 6 μm and 6 μm) through the larval oropharynx showing sox2, notch1a and dlB expression, respectively, during and before 5HT, ascl1a, Calb2b and miR-200 expression. (G-I) Comparison of the first appearing 5HT and Calb2b expression (60 hpf) with notch1a and dlB expression 4-5 hours earlier. These pictures are high magnifications of the branchial arch 2 half shown in A (inset), E,F. (J-L) Fgf receptors and ligands are expressed in the pharyngeal epithelium around the timing of taste bud formation. Whole-mount (J, lateral view) and sectioned (K,L-sagittal) larval oropharyngeal areas labelled with fgfr4 (J), fgfrl1a (K) and fgf8 (L) probes. Broken lines mark the limits of pharyngeal pouches (p1-5). The arrowheads in L indicate the restricted fgf8 expression in the pharyngeal pouches. (M-O) Horizontal optical section (1.5μm) through a tg(tph1b:egfp) transgenic embryo showing co-expression of the transgene (GFP) and 5HT. |
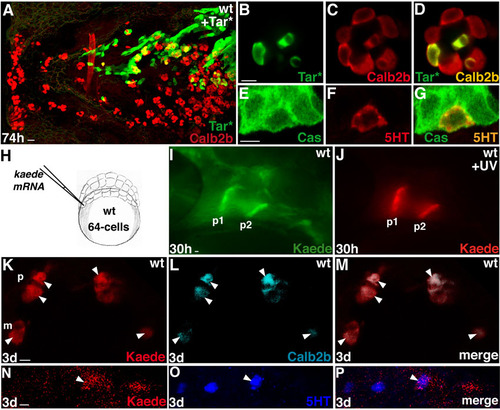
Fate-mapping experiments. (A-G) Traceable wild-type endodermal (Tar* or Cas) cells were transplanted at the blastula margin of wild-type embryos and examined for taste bud cell marker expression. This experimental procedure did not noticeably affect endogenous pharyngeal taste bud development (A). At 3 dpf, grafted pharyngeal endodermal cells expressed Calb2b (B-D, n=14) or 5HT (E-G, n=10). (H-P) kaede mRNA (Ando et al., 2002) was injected into one or two cells of the marginal zone of 64-cell embryos to target endoderm-derived pharyngeal pouches (H). Embryos were left to develop until 28-30 hpf in the dark, then mounted in 1% low melting agarose. Kaede protein was photoconverted by UV light from green to red, in pharyngeal pouch cells of wild-type embryos at 28-30 hpf (I,J, p1, p2) using a 20× or 40× objective of a Zeiss Axioplan microscope with an adapted DAPI filter and pinhole to adjust the diameter of the UV light beam. We observed that red and green Kaede forms were stable after fixation. Immunohistochemistry on whole-mount embryos or vibratome sections was carried out while protecting the tissue from direct light sources and all steps were carried out in the dark to avoid bleaching. Triton was omitted during washes. This protocol was compatible with the detection of the primary rabbit anti-Calb2b antibody (Swant) or anti-5HT (Sigma) combined with a secondary anti-rabbit conjugated with Alexa Fluor 680. Red photoconverted Kaede was localized in the pharyngeal epithelial cells in the surface of pharyngeal arches (n=15) or palate (n=3) at 3 dpf and some of these cells were also immunostained for Calb2b or 5HT (K-M,N-P). Scale bars: 10 μm in A,I; 5 μm in B-H,J-P. |
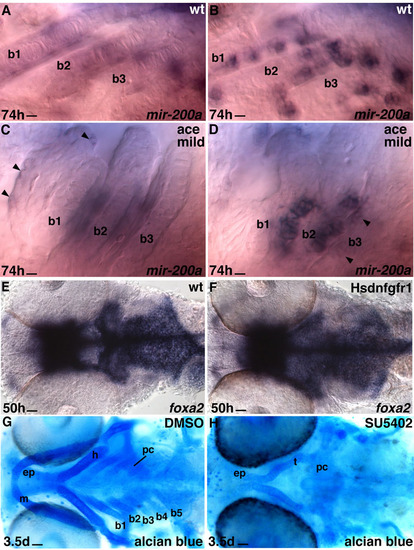
Wild-type and mild ace-/- zebrafish hybridized with miR-200a probe. (A-D) High magnification of branchial arches 1-3 (b1-3) of wild-type (A,C) and mild ace-/- phenotype (B,D) hybridized with miR-200a probe. The photos are focused on the cartilaginous cells (C,D) and taste buds expressing miR-200a (A,B,D). The arrowheads (C,D) indicate weakly labelled taste bud cells. Despite the mild differences in ace-/- cartilage formation, the taste bud cell number is reduced compared with the wild-type sibling. Scale bars: 7 μm. (E-H) Compromised Fgfr signaling in the oropharyngeal cavity affects pharyngeal arch development but not early endoderm marker expression. DMSO/SU5402 in wild type or heatshock in tg(hsp70l:dnfgfr1-EGFP)pd1/+ embryos was applied at 40 hpf. Ventral views of whole-mount larval heads labelled with foxa2 probe (E,F) or stained with Alcian Blue (G,H). Most of the pharyngeal cartilage is absent in the SU5402-treated embryo (H) compared with the control (DMSO, G). Scale bars: 20 μm. b1-b5, branchial arches 1-5; ep, ethmoid plate; h, hyoid arch; m, mandibular arch; oe, olfactory epithelium; pc, parachordal; t, trabeculae. |
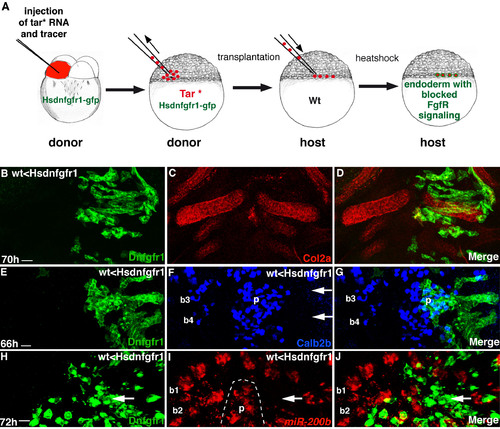
Fgf signaling is necessary within the pharyngeal endoderm for the formation of Calb2b+ and miR-200-expressing cells. (A) The experimental targeting of Fgfr blockage to endoderm. (B-J) Rostral towards the top. Confocal projections of ventral views of grafted endodermal (Tar*) cells in a wild-type embryo expressing Dnfgfr1 after heatshock. (B-D) Col2a expression in the cartilage (red) is comparable between control and Hsdnfgfr1-expressing (green) side. (E-G) An example of severe reduction of Calb2b expression in the Hsdnfgfr1-expressing (green) epithelium of branchial arches 3 and 4. (H-J) A smaller magnification of the graft showed in Fig. 3P-R, including the pharyngeal epithelial side (b1, b2, on the left) that is devoid of Dnfgfr1 expression. miR-200b expression is present in the b2 side without Dnfgfr1 expression but is severely reduced in the Dnfgfr1+ side (green). p, palate. |

Expression patterns of taste bud related markers in wild-type, control MO, single MOs and triple MOmiR-200-injected embryos. Confocal projections of ventral views, rostral towards the left. Scale bars: 15 μm. (A,B) pH3 (green) expression is comparable between wild-type (A) and triple MOmiR-200-injected (B) embryos, whereas Calb2b expression is severely reduced in the triple MOmiR-200 injected (B) embryo. (C-E2) Comparison of 5HT (green) and Calb2b (red) expression in wild-type (C), control MO (D) and triple MOmiR-200-injected (E) embryos. C and E are lower magnifications of the pictures shown in Fig. 5C,D. Calb2b cells are severely reduced but 5HT cells only mildly (E) compared with the controls in C,D. This reduction is not due to developmental delay (compare with Fig. S1A-C in the supplementary material). C2,E2 are confocal projections of 5HT and Calb2b expression in the brain (hypothalamus, hy; raphe, ra) of the embyos shown in C,E, respectively, showing that brain morphology is comparable between wild-type and triple MOmiR-200-injected embryos. (F,G) Comparison of Calb2b (green) and Col2a (red) expression in wild-type (F) and triple MOmiR-200 injected (G) embryos. Cartilage anatomy (red) is comparable between F and G, whereas Calb2b+ cells are severely reduced in G. (H-J) Single MO injections for miR-200a, miR-200b or miR-429 do not obviously affect taste bud development. Compare embryos injected with MOmiR-200a (H), MOmiR-200b (I), MOmiR-429 (J), with the wild-type embryo shown in Fig. 1A. Statistical analysis of control and MOmiR-200-injected embryos is provided in Table 3. |