
Fig. 3
- ID
- ZDB-FIG-110804-12
- Publication
- Kapsimali et al., 2011 - Fgf signaling controls pharyngeal taste bud formation through miR-200 and Delta-Notch activity
- Other Figures
- All Figure Page
- Back to All Figure Page
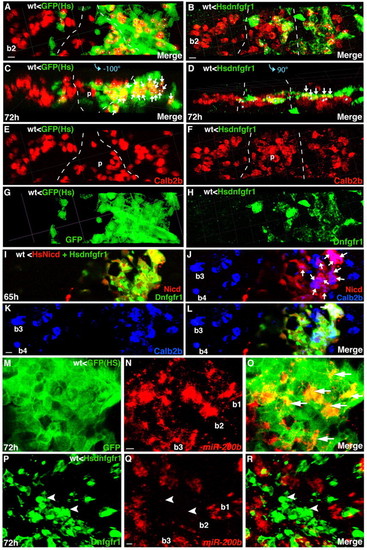
Fgf signaling is required within the pharyngeal endoderm for Calb2b+ cell formation. Experimental conditions are indicated in the top left- or right-hand corner, embryonic stage and scale bar are in the bottom left-hand corner and marker expression is in the bottom right-hand corner. Anterior is towards the top. Arrows indicate colocalization, arrowheads indicate exclusive marker expression. (A-L) Embryos from the same experiment. Scale bars: 5 μm. (A-H) Overlays (A-D) and single-color projections (E-H) of pharyngeal endodermal (Tar*) grafted cells (in wild type) that express GFP or Hsdnfgfr1 after heatshock. Broken lines mark the palate (p) cells. (C,D) Rotated 3D reconstructions of the views shown in A,B (–100°, +90°, respectively). In A-D, white dots are landmarks of individual cells with potential colocalization of tracer/Hsdnfgfr1 (green) and Calb2b (red). In A,C, almost all cells (17/20 dots) in branchial arch 2 (b2), co-express GFP and Calb2b (arrows, orange/yellow). By contrast, in B,D, only 5/15 cells (arrows, yellow) co-express Dnfgfr1 and Calb2b in b2. See also another example in Fig. S4E-G in the supplementary material. (I-L) Activation of Notch signaling restores Calb2b+ cell formation in pharyngeal epithelium with compromised Fgfr signaling. Confocal projection of pharyngeal endodermal (Tar*) grafted cells (in wild type) that express HsNicd (I,J,L, red/orange), Hsdnfgfr1 (I,L, green/orange) and Calb2b (J-L, blue/purple/cyan). (L) Superimposition of I,K. Arrows in J indicate cells with HsNicd and Calb2b co-expression. b3-b4, branchial arches 3-4. (M-O) Optical sections (2.5 μm); (P-R) confocal projection through pharyngeal endodermal (Tar*) grafted cells (in wild type) that express GFP (M-O, green) or Dnfgfr1 (P-R, green) and miR-200b (red) after heatshock. (O,R) Superimposition of M,N (O) and P,Q (R). GFP and miR-200b are co-expressed in many cells of several taste buds (arrows, yellow/orange), whereas miR-200b is absent from most Dnfgfr1+ cells (arrowheads) in b2. Scale bars: 4 μm. See also Fig. S4H-J in the supplementary material. |