
Fig. 1
- ID
- ZDB-FIG-110804-10
- Publication
- Kapsimali et al., 2011 - Fgf signaling controls pharyngeal taste bud formation through miR-200 and Delta-Notch activity
- Other Figures
- All Figure Page
- Back to All Figure Page
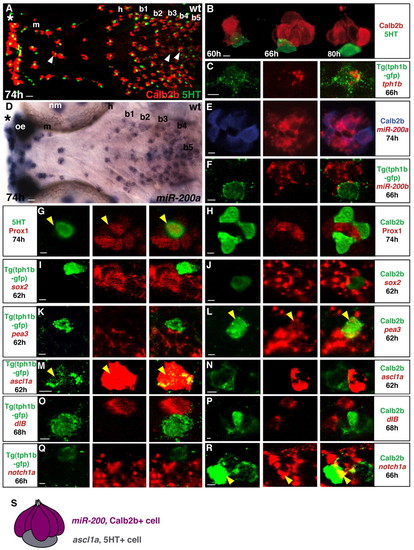
Taste buds are patterned in the zebrafish oropharynx and composed of distinct cell types. Marker expression in developing taste buds. Experimental conditions are indicated in the top right-hand corner, embryonic stage and scale bar are in the bottom left-hand corner and marker expression is in the bottom right-hand corner or on the left or right. Anterior is towards the left. (A,D) Ventral views of whole-mount zebrafish larvae heads showing taste bud cells expressing Calb2b (A, red), 5HT (A, green) or miR-200a (D, blue). Asterisks indicate the row of taste buds localized in the lips. Arrowheads in A indicate palate taste buds. Scale bar: 10 μm. (B) Confocal images showing the shape of the developing taste bud organ. (C) Optical section (1 μm) showing co-expression (yellow) of tph1b mRNA and GFP expression in Tg(tph1b:egfp) larva. (E-R) Optical sections (0.5-1.5 μm) showing the relationship between Calb2b, 5HT or Tg(tph1b:egfp) and other taste bud marker expression. Yellow arrowheads indicate marker co-expression in a single cell. (E) Most miR-200a (red) cells express Calb2b (blue). Scale bars: 2 μm. (S) The main markers discriminating Calb2b+ (purple) and 5HT+ (gray) cells. b1-b5, branchial arches 1-5; h, hyoid arch; m, mandibular arch; nm, neuromast; oe, olfactory epithelium. |
| Genes: | |
|---|---|
| Antibodies: | |
| Fish: | |
| Anatomical Terms: | |
| Stage Range: | Pec-fin to Protruding-mouth |