
- Title
-
Labelling and targeted ablation of specific bipolar cell types in the zebrafish retina
- Authors
- Zhao, X.F., Ellingsen, S., and Fjose, A.
- Source
- Full text @ BMC Neurosci.
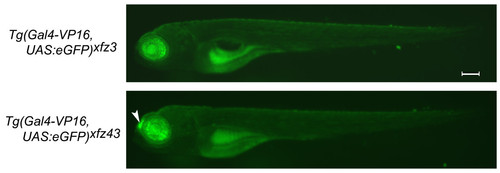
Spatial patterns of eGFP expression in two different enhancer trap lines. Fluorescence microscopy images of whole mount larvae at 5 dpf show eGFP expression restricted to the retina in both lines. The Tg(Gal4-VP16;UAS:eGFP)xfz43 line has an additional site of expression in the olfactory placodes (arrowhead). Both lines show some auto-fluorescence in the yolk sac and gut. Scale bar: 0.2 mm. EXPRESSION / LABELING:
|
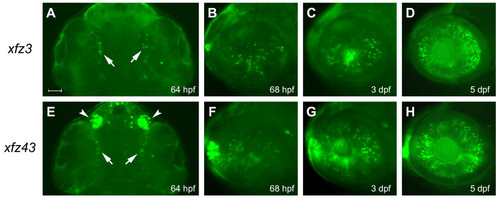
Retinal expression of eGFP in enhancer trap lines at early larval stages. Fluorescence microscopy of eGFP expression in the Tg(Gal4-VP16;UAS:eGFP)xfz3 line (A-D). A ventral view (A) shows initial eGFP labelling of single cells (arrows) within the ventral-nasal region of the retina at 64 hpf. Lateral views (B-D), with anterior to the left, show increasing numbers of eGFP expressing retinal cells at 68 hpf (B), 3 dpf (C) and 5 dpf (D). (E-H) Expression of eGFP in the Tg(Gal4-VP16;UAS:eGFP)xfz43 line. Ventral view (E) shows strong eGFP labelling in the olfactory placodes (arrowheads) and low levels of expression in single cells within the ventral-nasal region of the retina at 64 hpf (arrows). Lateral views (F-H), with anterior to the left, show increasing numbers of eGFP expressing retinal cells at 68 hpf (F), 3 dpf (G) and 5 dpf (H). Scale bar: 50 μm. |
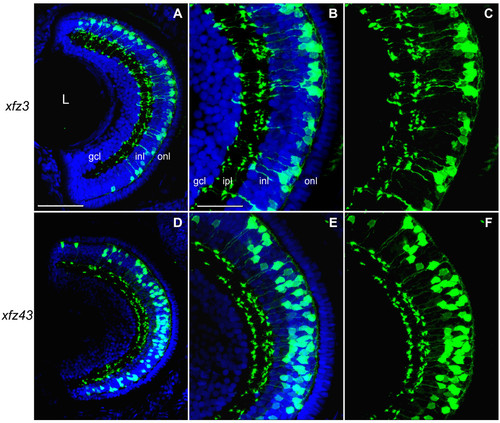
Enhancer trap lines express eGFP in different types of bipolar cells in larvae. Retinal cryosection of Tg(Gal4-VP16;UAS:eGFP)xfz3 larva at 5 dpf (A-C). (A) Confocal image of cross-section (dorsal at the top) stained with an anti-GFP antibody (green) and counterstained with DAPI (blue). (B) Higher magnification image of the central part of the retina shown in (A). (C) Same confocal image as in (B) without DAPI. (D-F) Retinal cryosection from a Tg(Gal4-VP16;UAS:eGFP)xfz43 larva at 5 dpf. The confocal images are arranged in the same way as shown for the other line. Scale bar: 50 μm (A, D); 25 μm (B, C, E, F). Abbreviations: gcl, ganglion cell layer; inl, inner nuclear layer; ipl, inner plexiform layer; L, lens; onl, outer nuclear layer. EXPRESSION / LABELING:
|
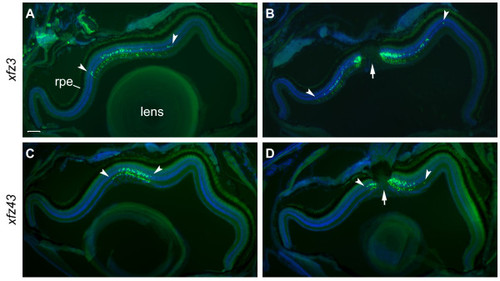
Regional distribution patterns of eGFP labelled bipolar cells in adult retina. Fluorescence images of retinal cross-sections from adult fish (6 months) from the transgenic lines Tg(Gal4-VP16;UAS:eGFP)xfz3 (A, B), and Tg(Gal4-VP16;UAS:eGFP)xfz43 (C, D). Sections were stained with an anti-GFP antibody (green) and counterstained with DAPI (blue). All images are oriented with the ventral side to the left. Arrowheads mark the central region containing eGFP labelled bipolar cells. The optic nerve is indicated by arrows (B, D). Scale bar: 100 μm. Abbreviation: rpe, retinal pigmented epithelium. EXPRESSION / LABELING:
|
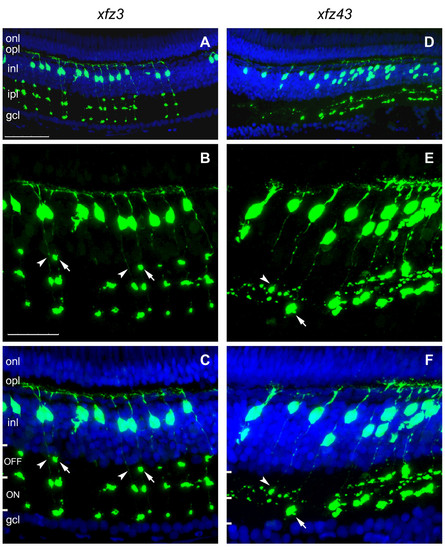
Axon terminal patterns within the adult retina define distinct types of bipolar cells. (A-C) Confocal images of a retinal cryosection, labelled with an anti-GFP antibody (green) and counterstained with DAPI (blue), from an adult Tg(Gal4-VP16;UAS:eGFP)xfz3 fish (6 months). Higher magnification images of the middle part in (A) are shown in (B, C). The image in (B) is the same as in (C) but without DAPI. Arrows in (B, C) indicate a bouton-like axon terminal structure in the OFF layer, which is present in one bipolar cell type but absent in the other (arrowheads). (D-F) Retinal cryosection from an adult Tg(Gal4-VP16;UAS:eGFP)xfz43 fish. The confocal images are arranged in the same way as shown for the other line. Arrows in (E, F) indicate a large bouton-like structure in the ON sublamina, which is present at the axon terminal of one bipolar cell type. A second type of bipolar cells shows terminal arborisation within the OFF sublamina (arrowheads). ON and OFF sublamina of the inner plexiform layer are indicated by bars in (C, F). Scale bars: 50 μm (A, D); 25 μm (B, C, E, F). Abbreviations: gcl, ganglion cell layer; inl, inner nuclear layer; ipl, inner plexiform layer; onl, outer nuclear layer; opl, outer plexiform layer. EXPRESSION / LABELING:
|
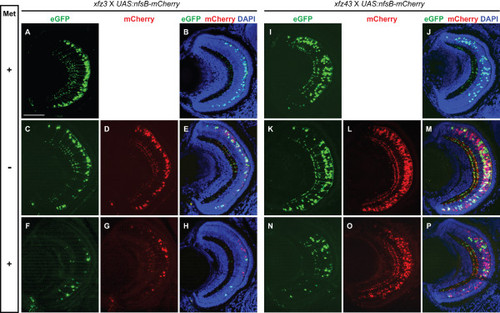
Prodrug dependent ablation of specific bipolar cell types in larvae from enhancer trap lines. (A-H) Confocal images of retinal cross-sections from larvae (5 dpf) produced by mating of UAS:nfsB-mCherry transgenic fish to Tg(Gal4-VP16;UAS:eGFP)xfz3. (A, B) Retina from a larva without the UAS:nfsB-mCherry fusion gene that was unaffected by Met treatment. (C-E) Retina from larva expressing NTR-mCherry (red) in bipolar cells. (F-H) Retina from larva expressing NTR-mCherry (red) showed loss of fluorescently labelled bipolar cells following Met treatment. (I-P) The same type of analysis as in (A-H) conducted on larvae produced by mating of UAS:nfsB-mCherry transgenic fish to Tg(Gal4-VP16;UAS:eGFP)xfz43. (N-P) Significant degeneration and loss of labelled bipolar cells occurred in the retina of Met treated larvae. Labelling to the left indicate Met treatment (+) and no treatment (-). The crosses and different types of fluorescence are indicated at the top. Scale bar: 50 μm. |
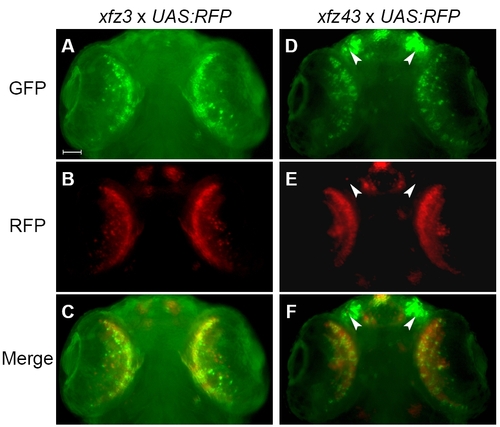
Transactivation of a UAS-regulated gene in retinal bipolar cells of the enhancer trap lines. Induced expression of red fluorescent protein (RFP) from a UAS:RFP construct in larvae at 3 dpf demonstrated for both transgenic lines the presence of Gal4-V16 in retinal bipolar cells, and its absence from the olfactory placodes in xfz43 (arrowheads). Scale bar: 50 μm. |
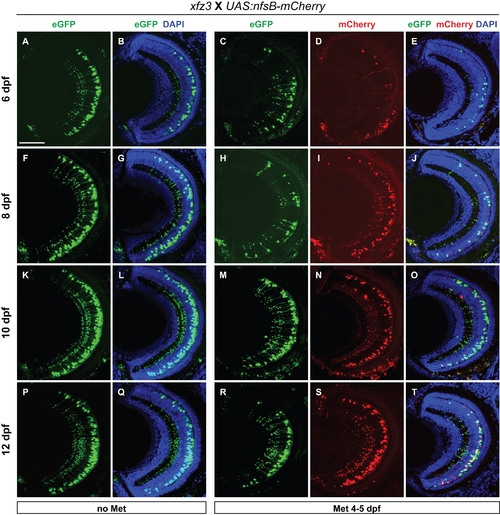
Retina recovery in larval progeny from the xfz3 × UAS:nfsB-mCherry mating. Retinal cryosections were obtained from larvae at different time points during a period of seven days following removal of Met at 5 dpf. The left panel (labelled ′no Met′ at the top) show confocal images of retina cross-sections from untreated siblings expressing only Gal4-VP16/eGFP. The right panel (labelled ′Met 4–5 dpf′) show confocal images of retina cross-sections from NTR-mCherry expressing larvae following removal of Met. The different time points and corresponding larval stages are: (C-E) 1 day post-treatment (6 dpf); (H-J) 3 days (8 dpf); (M-O) 5 days (10 dpf); (R-T) 7 days (12 dpf). The different types of fluorescence are indicated at the top. Scale bar: 50 μm. |
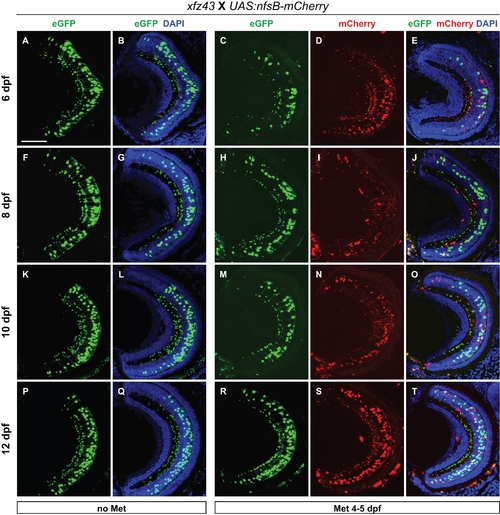
Retina recovery in larval progeny from the xfz43 x UAS:nfsB-mCherry mating. Confocal images of retina cross-sections from different stages of untreated siblings, which express only Gal4-VP16/eGFP (left panel), and Met treated larvae expressing NTR-mCherry (right panel) are arranged in the same way as described in Additional file 2: Figure S2. Scale bar: 50 μm. |

Apoptotic cells in retina of prodrug treated larvae from the xfz43 x UAS:nfsB-mCherry mating. (A, B) Higher magnifications are shown for areas from Figure 7L, O, respectively. Retina from Met treated larva (B) show rounded NTR-mCherry labelled cells lacking axons. The axon termini in both the IPL and OPL (arrowheads) are also disintegrating. Scale bar: 25 μm. |