
FIGURE
Fig. 1
Fig. 1
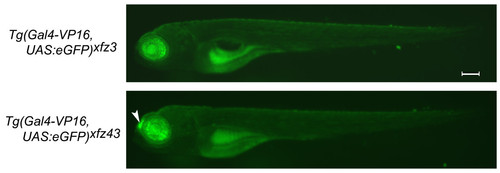
Spatial patterns of eGFP expression in two different enhancer trap lines. Fluorescence microscopy images of whole mount larvae at 5 dpf show eGFP expression restricted to the retina in both lines. The Tg(Gal4-VP16;UAS:eGFP)xfz43 line has an additional site of expression in the olfactory placodes (arrowhead). Both lines show some auto-fluorescence in the yolk sac and gut. Scale bar: 0.2 mm. |
Expression Data
| Gene: | |
|---|---|
| Fish: | |
| Anatomical Terms: | |
| Stage: | Day 5 |
Expression Detail
Antibody Labeling
Phenotype Data
Phenotype Detail
Acknowledgments
This image is the copyrighted work of the attributed author or publisher, and
ZFIN has permission only to display this image to its users.
Additional permissions should be obtained from the applicable author or publisher of the image.
Full text @ BMC Neurosci.