|
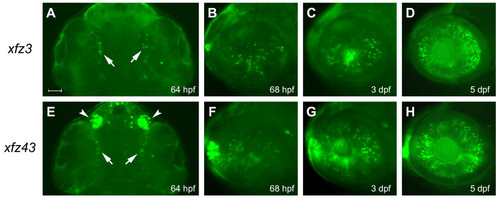
Retinal expression of eGFP in enhancer trap lines at early larval stages. Fluorescence microscopy of eGFP expression in the Tg(Gal4-VP16;UAS:eGFP)xfz3 line (A-D). A ventral view (A) shows initial eGFP labelling of single cells (arrows) within the ventral-nasal region of the retina at 64 hpf. Lateral views (B-D), with anterior to the left, show increasing numbers of eGFP expressing retinal cells at 68 hpf (B), 3 dpf (C) and 5 dpf (D). (E-H) Expression of eGFP in the Tg(Gal4-VP16;UAS:eGFP)xfz43 line. Ventral view (E) shows strong eGFP labelling in the olfactory placodes (arrowheads) and low levels of expression in single cells within the ventral-nasal region of the retina at 64 hpf (arrows). Lateral views (F-H), with anterior to the left, show increasing numbers of eGFP expressing retinal cells at 68 hpf (F), 3 dpf (G) and 5 dpf (H). Scale bar: 50 μm.
|