
- Title
-
Automated image-based phenotypic analysis in zebrafish embryos
- Authors
- Vogt, A., Cholewinski, A., Shen, X., Nelson, S.G., Lazo, J.S., Tsang, M., and Hukriede, N.A.
- Source
- Full text @ Dev. Dyn.

Successive assembly of a hierarchical network identifies intersegmental vessels (ISV) in Tg(fli1:EGFP)y1 embryos. At 48 hours postfertilization (hpf), Tg(fli1:EGFP)y1 zebrafish embryos were imaged on an ArrayScan II high-content reader equipped with a x1.25 objective. A,B: The original image (A) was segmented based on pixel intensities and regional variability (B). C,D: Regions of high variability (C) were fused and expanded to provide a general outline (D). E,F: The outline was refined (E) to demarcate the whole zebrafish embryo (F). G,H: Specific subdomains within the embryo such as head, dorsal aorta/posterior cardinal vein, yolk (G), and dorsal area (H, gray) were then assigned through successive interactive loops of locally specific segmentation and classification, resulting in a hierarchical structure of the entire embryo with its subdomains. I: Knowledge generated during each prior classification step enabled the ruleset to specifically quantify ISV in the dorsal tail (red) without interference from other fluorescent regions. DA, Dorsal aorta; PCV, posterior cardinal vein; ISV, intersegmental vessels; DLAV, dorsal longitudinal anastomotic vessel. |
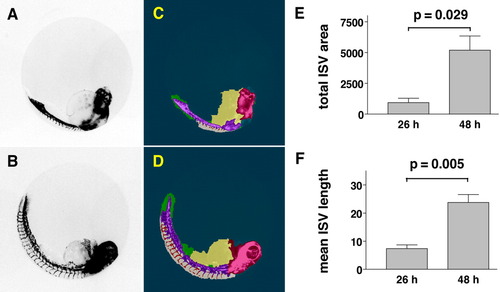
Quantitation of intersegmental vessels (ISV) at two distinct developmental stages. Tg(fli1:EGFP)y1 zebrafish embryos were imaged on the ArrayScan II and analyzed. A,B: Fluorescence micrographs showing sprouting of ISV at 26 hours postfertilization (hpf) and 48 hpf. C,D: Images with Cognition Network Technology (CNT) applied. E,F: The ruleset detected ISV in the dorsal tail at each developmental stage and provided numerical measurements of ISV development. Data are the average ISV length or total area ± SEM from four embryos per condition. Units of measurement are in pixels. P values were calculated by two-tailed Student's t-test. |
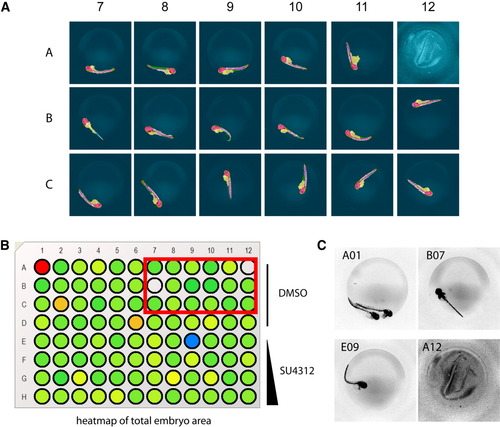
Analysis of Tg(fli1:EGFP)y1 zebrafish embryos in multi-well plates. Tg(fli1:EGFP)y1 zebrafish embryos were treated at 24 hours postfertilization (hpf) with vehicle or test agents and kept in medium for an additional 24 hr. Embryos were removed from their chorions, placed in the wells of a 96-well microplate and imaged on the ArrayScan II. A: Selected well micrographs with Cognition Network Technology (CNT) applied, red box in B, of vehicle-treated embryos illustrate positioning variations and plate-loading artifacts. Most embryos presented in lateral view and in those cases the CNT ruleset correctly detected the embryo, large vessels, ventral and dorsal areas, and quantified intersegmental vessels (ISV). B,C: Total embryo size measurements provided an option to tag or eliminate wells containing artifacts due to erroneous loading (A01, A12), dorsal view presentation (B07), or toxicity (E09). Rows A-D, dimethyl sulfoxide (DMSO) control. Rows E-H, 1.25 μM, 5 μM, 10 μM, and 25 μM SU4312, respectively. |
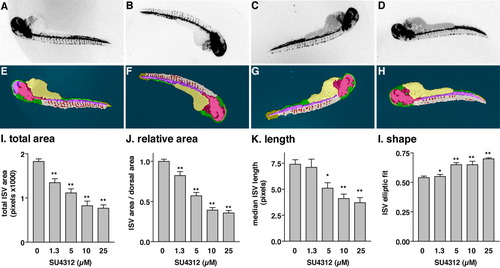
Quantitation of intersegmental vessels (ISV) in Tg(fli1:EGFP)y1 embryos treated with a known antiangiogenic agent. A-D: Embryos were treated at 24 hpf with vehicle (dimethyl sulfoxide, DMSO; A) or the indicated concentrations of SU4312, a vascular endothelial growth factor (VEGF) receptor antagonist: 1.25 μM (B), 5 μM (C), 25 μM (D). After an additional 24 hr, dechorionated embryos were transferred to a 96-well plate, scanned on the ArrayScan II, and analyzed with the Cognition Network Technology (CNT) ruleset. A-D: Archived, inverted fluorescence images from the plate scan. E-H: Images with CNT analysis applied. B,C: At lower concentrations, SU4312 caused a partial inhibition phenotype that was difficult to unambiguously assign by visual inspection. I-L: Quantitative measurements of ISV. The ruleset delivered graded responses for area, length, and shape. IC50 values of SU4312 were consistent for all four readouts. I-L: Data were normalized to vehicle-treated controls. Graphs represent the averages ± SEM of at least three independent experiments (n = 12, except for vehicle n = 45). Statistical analysis was performed by one-way analysis of variance followed by Dunnett′s multiple comparison test. *P < 0.05; **P < 0.01. |