
Fig. 4
- ID
- ZDB-FIG-090310-14
- Publication
- Vogt et al., 2009 - Automated image-based phenotypic analysis in zebrafish embryos
- Other Figures
- All Figure Page
- Back to All Figure Page
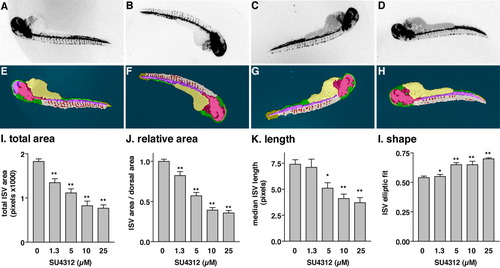
Quantitation of intersegmental vessels (ISV) in Tg(fli1:EGFP)y1 embryos treated with a known antiangiogenic agent. A-D: Embryos were treated at 24 hpf with vehicle (dimethyl sulfoxide, DMSO; A) or the indicated concentrations of SU4312, a vascular endothelial growth factor (VEGF) receptor antagonist: 1.25 μM (B), 5 μM (C), 25 μM (D). After an additional 24 hr, dechorionated embryos were transferred to a 96-well plate, scanned on the ArrayScan II, and analyzed with the Cognition Network Technology (CNT) ruleset. A-D: Archived, inverted fluorescence images from the plate scan. E-H: Images with CNT analysis applied. B,C: At lower concentrations, SU4312 caused a partial inhibition phenotype that was difficult to unambiguously assign by visual inspection. I-L: Quantitative measurements of ISV. The ruleset delivered graded responses for area, length, and shape. IC50 values of SU4312 were consistent for all four readouts. I-L: Data were normalized to vehicle-treated controls. Graphs represent the averages ± SEM of at least three independent experiments (n = 12, except for vehicle n = 45). Statistical analysis was performed by one-way analysis of variance followed by Dunnett′s multiple comparison test. *P < 0.05; **P < 0.01. |