
Fig. 3
- ID
- ZDB-FIG-090310-13
- Publication
- Vogt et al., 2009 - Automated image-based phenotypic analysis in zebrafish embryos
- Other Figures
- All Figure Page
- Back to All Figure Page
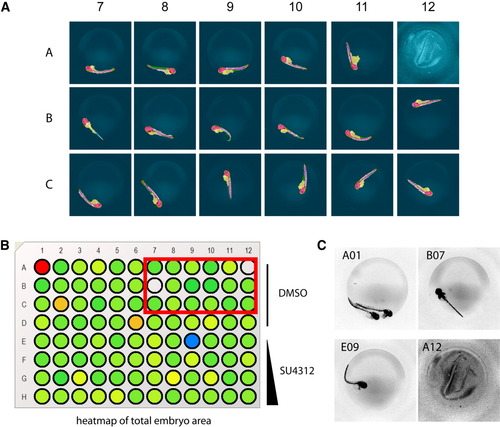
Analysis of Tg(fli1:EGFP)y1 zebrafish embryos in multi-well plates. Tg(fli1:EGFP)y1 zebrafish embryos were treated at 24 hours postfertilization (hpf) with vehicle or test agents and kept in medium for an additional 24 hr. Embryos were removed from their chorions, placed in the wells of a 96-well microplate and imaged on the ArrayScan II. A: Selected well micrographs with Cognition Network Technology (CNT) applied, red box in B, of vehicle-treated embryos illustrate positioning variations and plate-loading artifacts. Most embryos presented in lateral view and in those cases the CNT ruleset correctly detected the embryo, large vessels, ventral and dorsal areas, and quantified intersegmental vessels (ISV). B,C: Total embryo size measurements provided an option to tag or eliminate wells containing artifacts due to erroneous loading (A01, A12), dorsal view presentation (B07), or toxicity (E09). Rows A-D, dimethyl sulfoxide (DMSO) control. Rows E-H, 1.25 μM, 5 μM, 10 μM, and 25 μM SU4312, respectively. |