
|
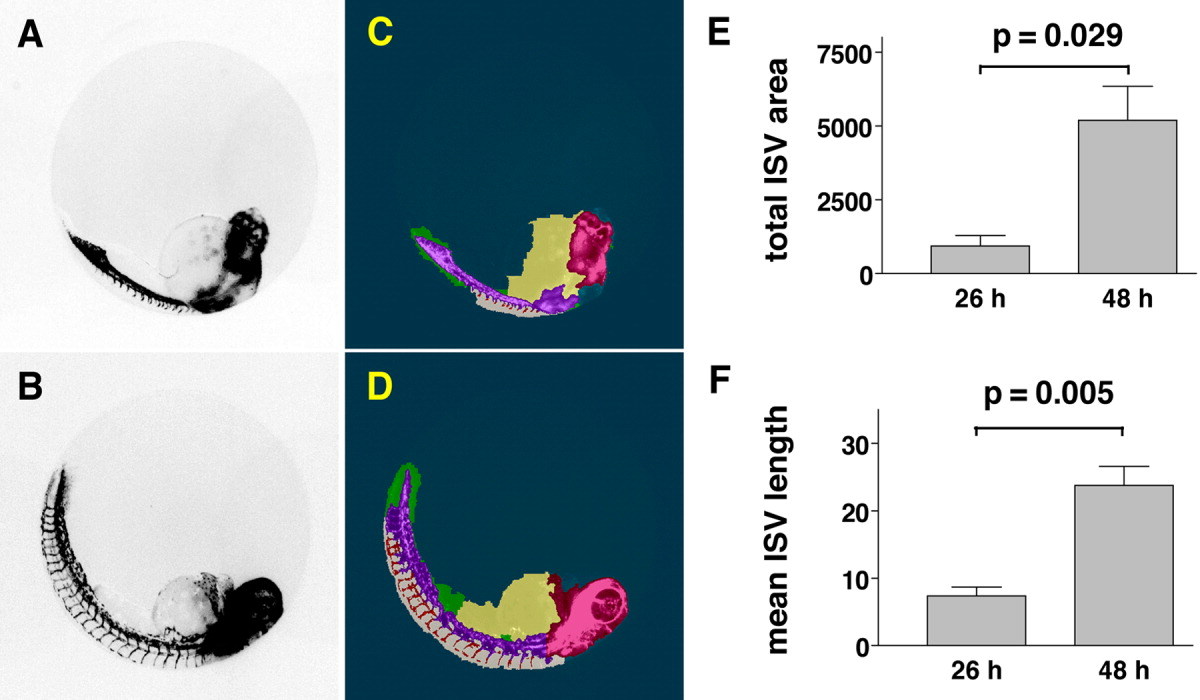
Fig. 2 Quantitation of intersegmental vessels (ISV) at two distinct developmental stages. Tg(fli1:EGFP)y1 zebrafish embryos were imaged on the ArrayScan II and analyzed. A,B: Fluorescence micrographs showing sprouting of ISV at 26 hours postfertilization (hpf) and 48 hpf. C,D: Images with Cognition Network Technology (CNT) applied. E,F: The ruleset detected ISV in the dorsal tail at each developmental stage and provided numerical measurements of ISV development. Data are the average ISV length or total area ± SEM from four embryos per condition. Units of measurement are in pixels. P values were calculated by two-tailed Student's t-test.