
- Title
-
G2 acquisition by transcription-independent mechanism at the zebrafish midblastula transition
- Authors
- Dalle Nogare, D.E., Pauerstein, P.T., and Lane, M.E.
- Source
- Full text @ Dev. Biol.
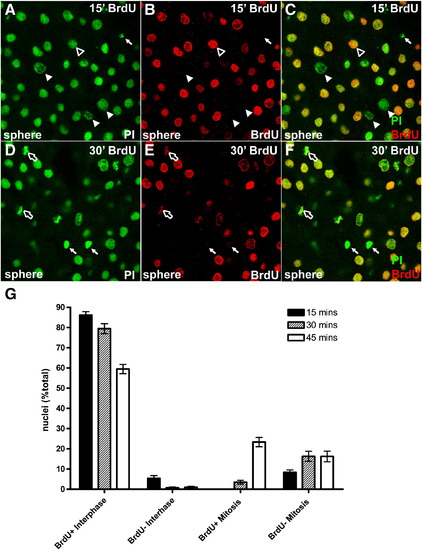
Mitotic pileup assay in post-MBT embryos. (A–F) Wild type embryos injected with BrdU and nocodazole at sphere stage, and incubated for 15 (A–C) or 30 (D–F) minutes before fixation and BrdU detection. Propidium iodide stained nuclei are labeled green, with BrdU positive nuclei labeled red. White arrowheads indicate BrdU-negative interphase nuclei, black and white arrowheads indicate BrdU-positive nuclei, white arrows indicate BrdU-negative mitotic figures, and black and white arrows indicate BrdU-positive mitotic figures. (G) Quantitation of BrdU-labeled mitotic pileup experiments. Filled bars represent a 15-minute BrdU pulse, hashed bars represent a 30-minute pulse, and open bars represent a 45-minute pulse. For each data point, n > 15 fields and > 300 cells. |
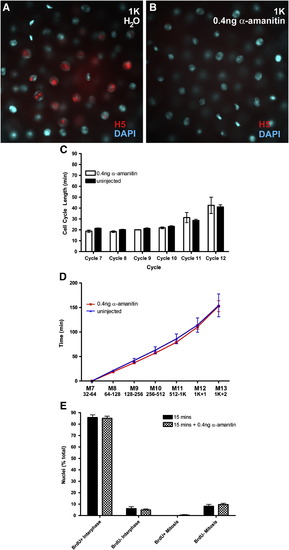
Cell cycle lengths and G2 determination in transcription-blocked embryos. (A, B) 1K-stage embryos that had been injected with water (A) or 0.4 ng α-amanitin (B) during cleavage, stained for nuclei (blue) and the H5 antigen (red). (C, D) cell cycle lengths (C) and timing of divisions (D) measured by time-lapse microscopy. White bars and red line are α-amanitin treated embryos, black bars and blue line are control embryos. (E) Mitotic pileup data from a 15-minute BrdU-nocodazole pulse showing the distribution of the four classes of nuclei in untreated (black bars) and α-amanitin treated (checkered bars) injected embryos. |
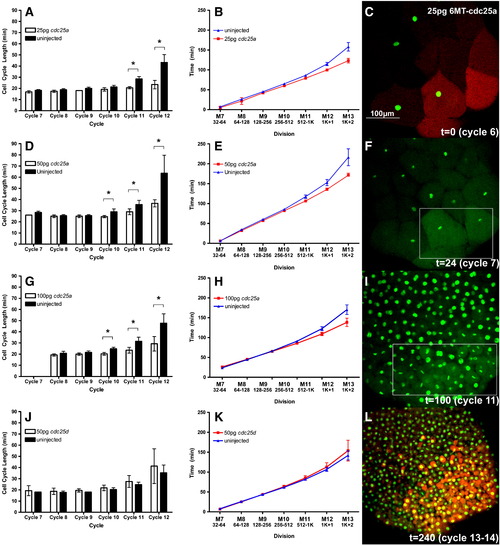
Time-lapse analysis of cell cycle lengthening in embryos injected with Alexafluor-488 labeled Histone (green in C, F, I and L) and clonal injection of rhodamine dextran with 25 pg (A, B), 50 pg (D, E) or 100 pg (G, H) mRNA encoding 6MT-cdc25a or 50 pg 6MT-cdc25d (J, K). Open bars (A, D, G, J) or red lines (B, E, H, K) are injected cell lineages and filled bars (A, D, G, J) or blue lines (B, E, H, K, E–H) are uninjected control cells. Panels C, F, I and L are frames from a time-lapse movie of an embryo injected with 25 pg 6MT-cdc25a mRNA and rhodamine-dextran. Panels C and L are initial and final frames showing the rhodamine-dextran signal. White boxes in panels F and I indicate the approximate location of the injected clone. Brackets and asterisks indicate that differences between injected and uninjected cell cycle lengths are statistically significant (p < 0.05). |
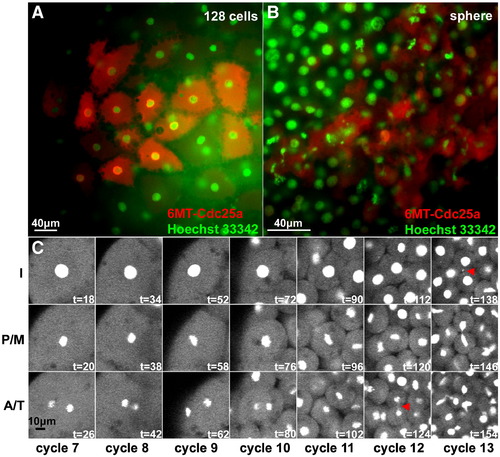
Cdc25a misexpression and DNA morphology in pre- and post-MBT clones. Embryos injected with 25 pg of mRNA encoding 6MT-cdc25a into single blastomeres at the 8-cell stage and then processed for anti-Myc immunofluorescence (red) and counterstained with Hoechst 33342 (green). Panels A and B show a pre-MBT (128-cells) and post-MBT (sphere) embryo, respectively. Panel C shows time-lapse frames documenting mitotic divisions from cycle 7 through cycle 13, for a single cell lineage in a clone injected with 25 pg 6MT-cdc25a mRNA. Red arrowheads show small chromatin bridges observed at the 1K + 1 division. I = interphase; P/M = pro-metaphase/metaphase; A/T = anaphase/telophase. |

BrdU mitotic pileup in clones injected with 50 pg egfp mRNA (A–C) or 50 pg 6MT-cdc25a mRNA (D–F). Embryos were injected with mRNA mixed with 70 K rhodamine dextran (C, F) then exposed to BrdU and nocodazole at 28 °C for 15 min. Embryos were then stained with anti-BrdU monoclonal antibody (white in B, E; green, C, F) and nuclei were counterstained with TO-PRO 3 (white in A, D; blue in C, F). Red arrowheads in panels A, B, D and E indicate BrdU-positive mitotic figures, and white arrowheads in A indicate BrdU-negative mitotic figures. |
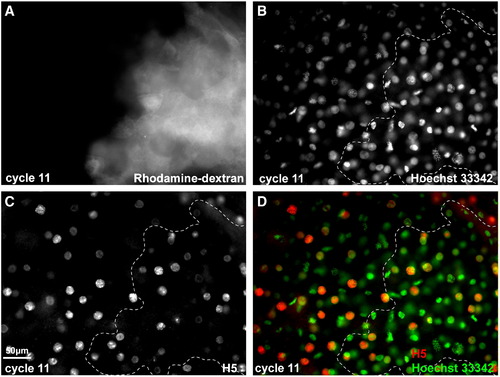
Zygotic genome activation in a cell clone injected with 50 pg 6MT-cdc25a mRNA in 70K-Rhodamine Dextran (A) at the 8-cell stage (A–D). Embryos were fixed in cycle 11 (1K + 1) and stained with anti-H5 monoclonal antibody (white in C; red in D) and Hoechst 33342 (white in B; green in D). D: Overlay of panels A–C. The Rhodamine dextran-positive clone is outlined with a dashed line in B–D. |
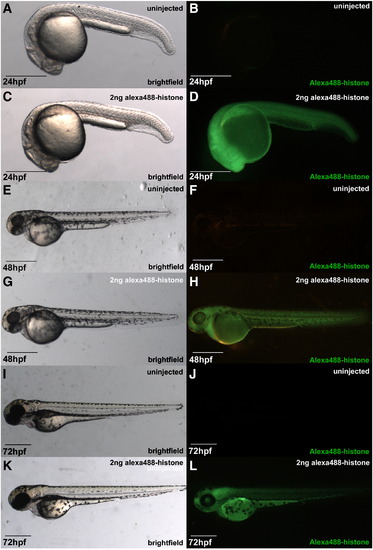
Viability of embryo injected with Alexa488-Histone proteins. Injected and uninjected sibling embryos at 24 (A–D), 48 (E–H), and 72 hpf (I–L) viewed by bright-field (left column) and epifluorescence (right column) microscopy. |
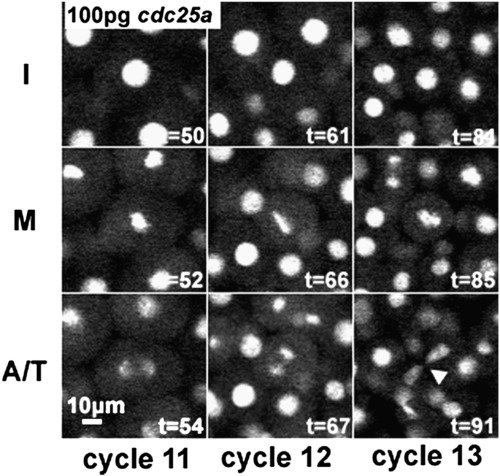
Time-lapse frames documenting cycle 11–13, for a single cell lineage in a clone injected with 100 pg 6MT-cdc25a mRNA. Arrowhead in lower right panel indicates abnormal mitotic figure. As with 25 pg cdc25a (Fig. 5), we only see abnormal mitotic figures in cycles 12 or 13. |
Reprinted from Developmental Biology, 326(1), Dalle Nogare, D.E., Pauerstein, P.T., and Lane, M.E., G2 acquisition by transcription-independent mechanism at the zebrafish midblastula transition, 131-142, Copyright (2009) with permission from Elsevier. Full text @ Dev. Biol.