
|
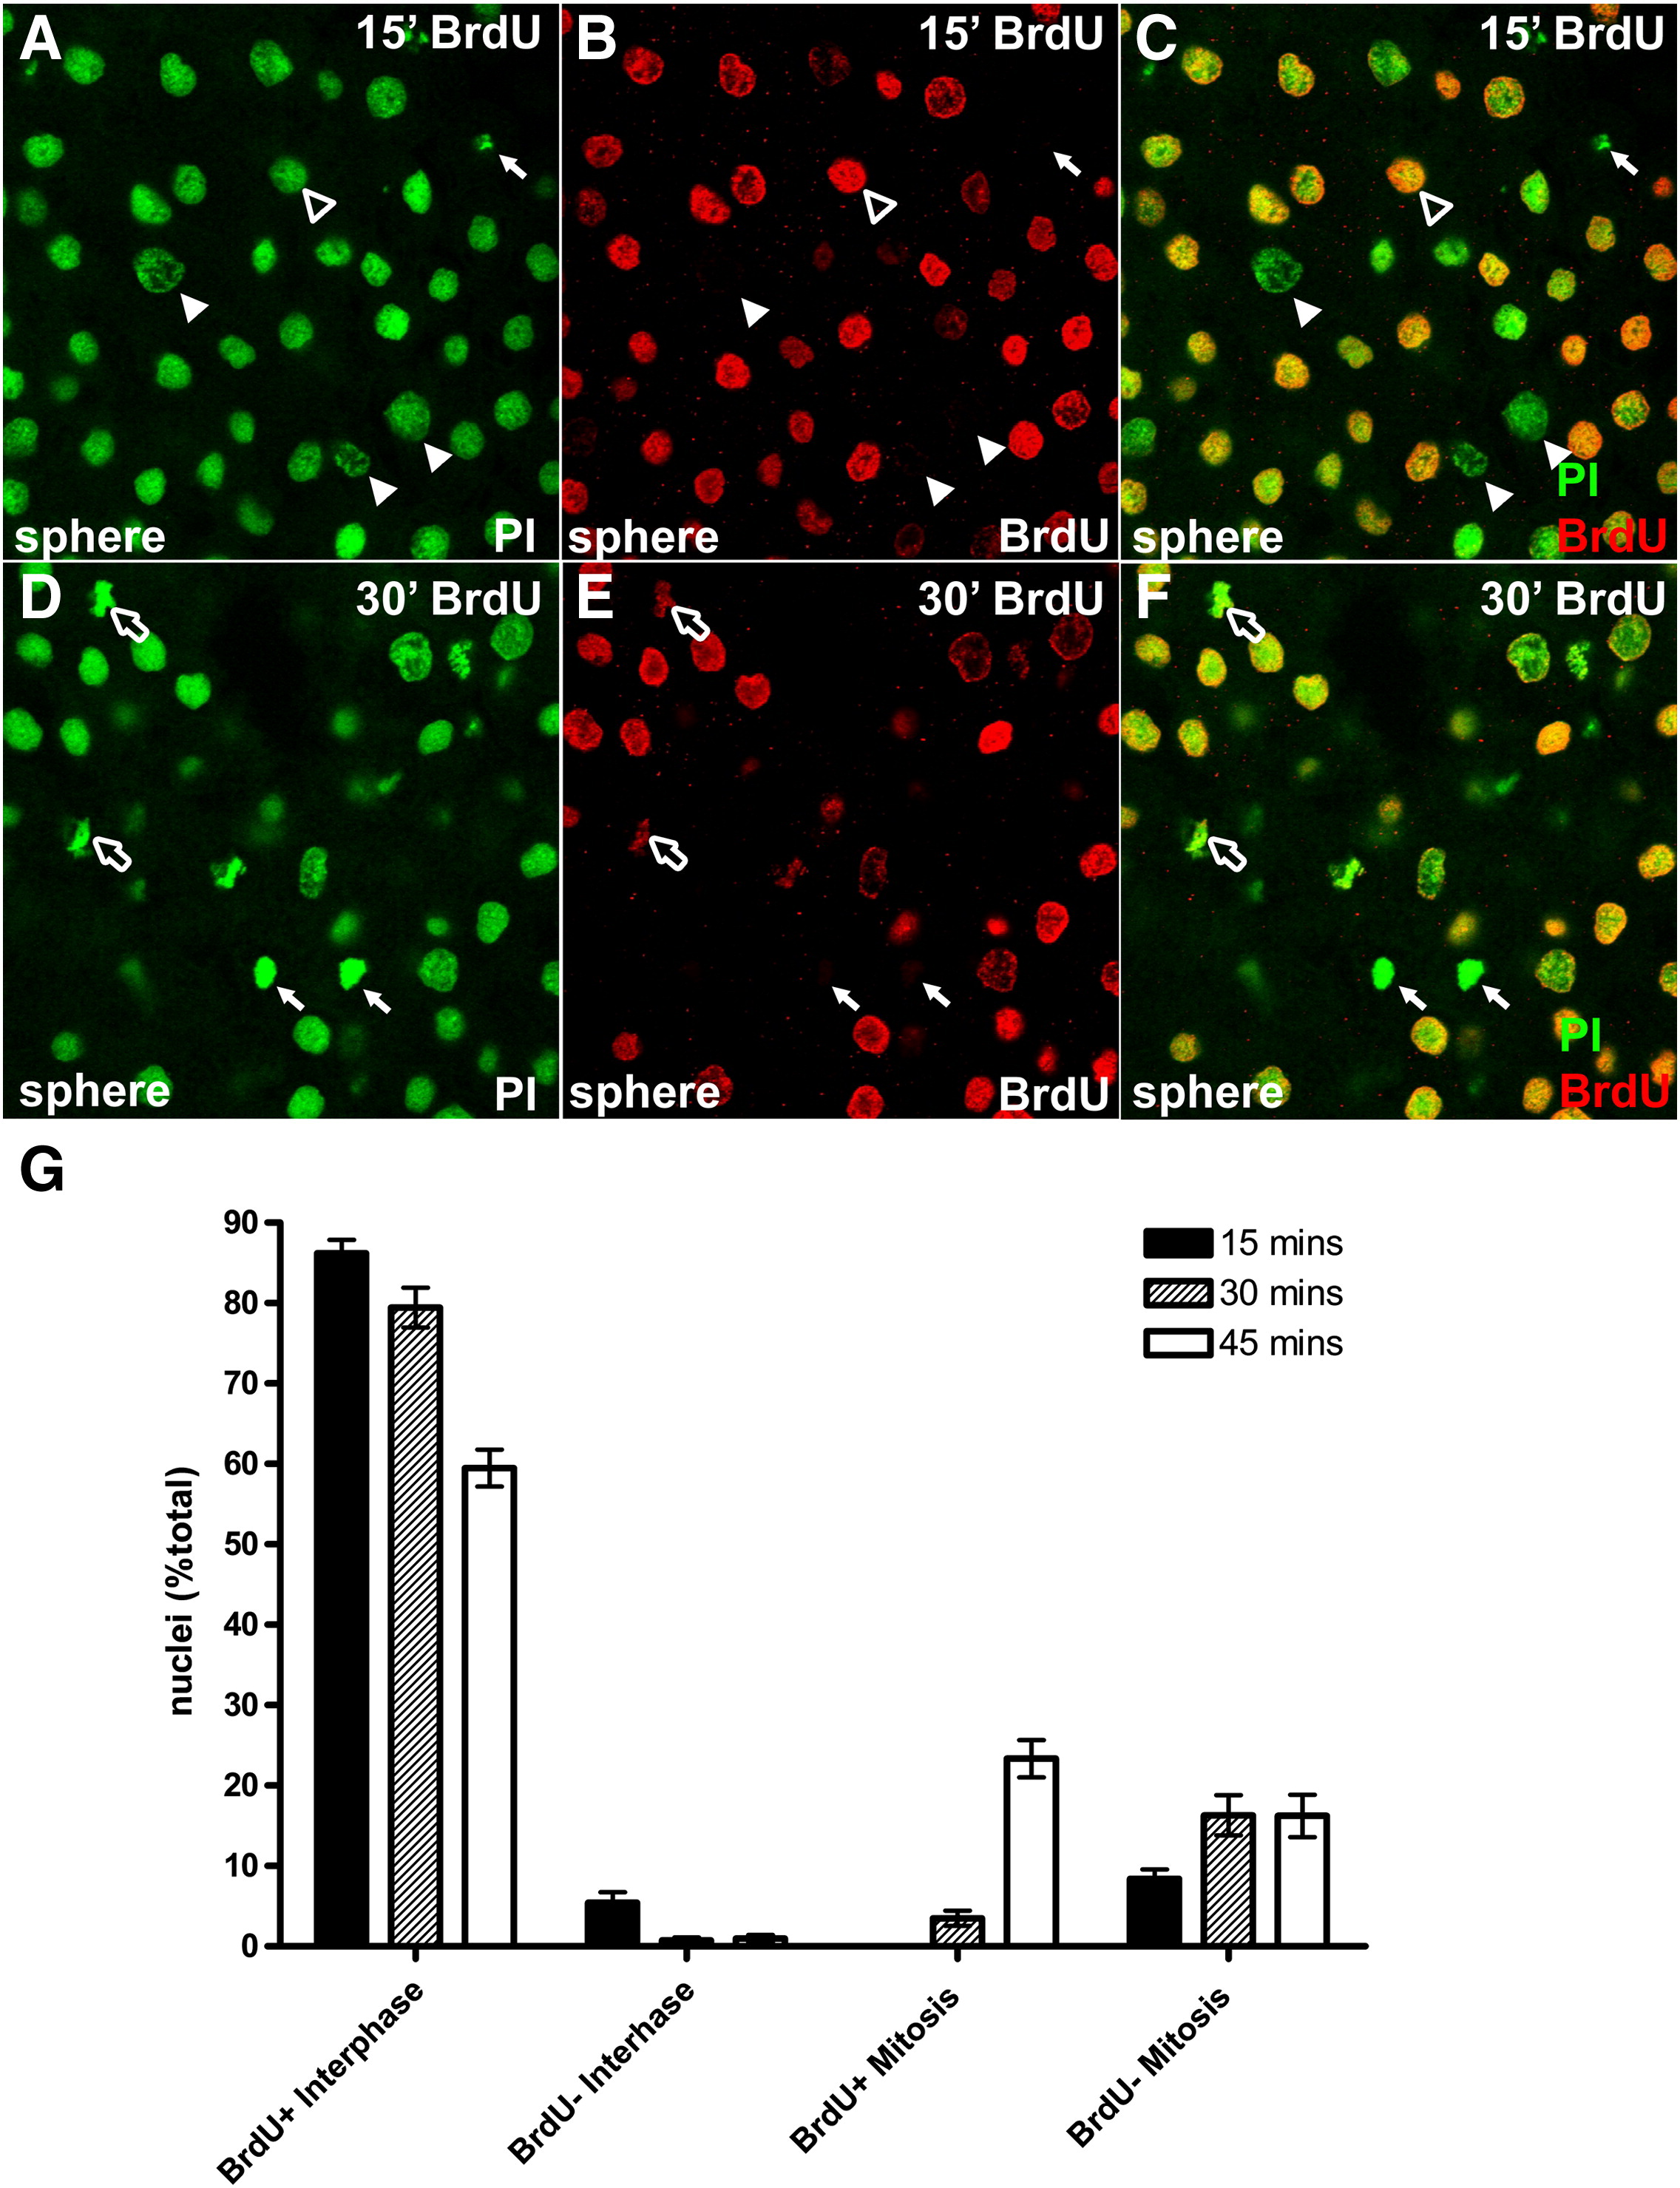
Fig. 1 Mitotic pileup assay in post-MBT embryos. (A–F) Wild type embryos injected with BrdU and nocodazole at sphere stage, and incubated for 15 (A–C) or 30 (D–F) minutes before fixation and BrdU detection. Propidium iodide stained nuclei are labeled green, with BrdU positive nuclei labeled red. White arrowheads indicate BrdU-negative interphase nuclei, black and white arrowheads indicate BrdU-positive nuclei, white arrows indicate BrdU-negative mitotic figures, and black and white arrows indicate BrdU-positive mitotic figures. (G) Quantitation of BrdU-labeled mitotic pileup experiments. Filled bars represent a 15-minute BrdU pulse, hashed bars represent a 30-minute pulse, and open bars represent a 45-minute pulse. For each data point, n > 15 fields and > 300 cells.
Reprinted from Developmental Biology, 326(1), Dalle Nogare, D.E., Pauerstein, P.T., and Lane, M.E., G2 acquisition by transcription-independent mechanism at the zebrafish midblastula transition, 131-142, Copyright (2009) with permission from Elsevier. Full text @ Dev. Biol.