
Fig. 2
- ID
- ZDB-FIG-090220-49
- Publication
- Dalle Nogare et al., 2009 - G2 acquisition by transcription-independent mechanism at the zebrafish midblastula transition
- Other Figures
- All Figure Page
- Back to All Figure Page
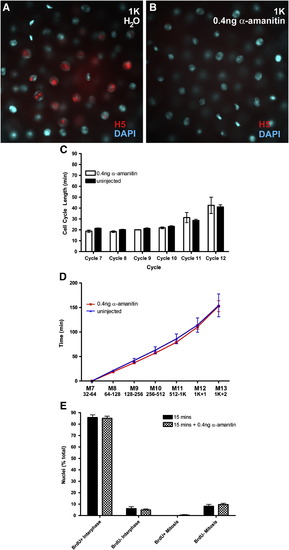
Cell cycle lengths and G2 determination in transcription-blocked embryos. (A, B) 1K-stage embryos that had been injected with water (A) or 0.4 ng α-amanitin (B) during cleavage, stained for nuclei (blue) and the H5 antigen (red). (C, D) cell cycle lengths (C) and timing of divisions (D) measured by time-lapse microscopy. White bars and red line are α-amanitin treated embryos, black bars and blue line are control embryos. (E) Mitotic pileup data from a 15-minute BrdU-nocodazole pulse showing the distribution of the four classes of nuclei in untreated (black bars) and α-amanitin treated (checkered bars) injected embryos. |
Reprinted from Developmental Biology, 326(1), Dalle Nogare, D.E., Pauerstein, P.T., and Lane, M.E., G2 acquisition by transcription-independent mechanism at the zebrafish midblastula transition, 131-142, Copyright (2009) with permission from Elsevier. Full text @ Dev. Biol.