
Fig. 5
- ID
- ZDB-FIG-090220-51
- Publication
- Dalle Nogare et al., 2009 - G2 acquisition by transcription-independent mechanism at the zebrafish midblastula transition
- Other Figures
- All Figure Page
- Back to All Figure Page
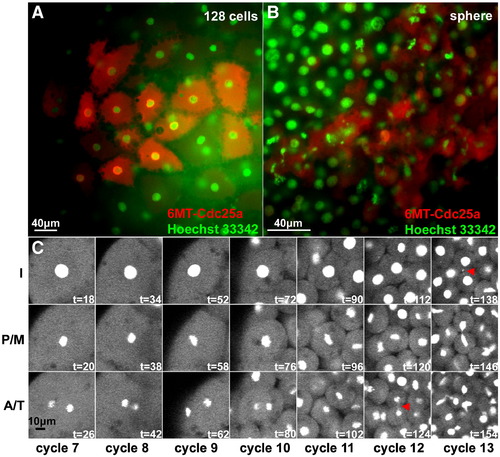
Cdc25a misexpression and DNA morphology in pre- and post-MBT clones. Embryos injected with 25 pg of mRNA encoding 6MT-cdc25a into single blastomeres at the 8-cell stage and then processed for anti-Myc immunofluorescence (red) and counterstained with Hoechst 33342 (green). Panels A and B show a pre-MBT (128-cells) and post-MBT (sphere) embryo, respectively. Panel C shows time-lapse frames documenting mitotic divisions from cycle 7 through cycle 13, for a single cell lineage in a clone injected with 25 pg 6MT-cdc25a mRNA. Red arrowheads show small chromatin bridges observed at the 1K + 1 division. I = interphase; P/M = pro-metaphase/metaphase; A/T = anaphase/telophase. |
Reprinted from Developmental Biology, 326(1), Dalle Nogare, D.E., Pauerstein, P.T., and Lane, M.E., G2 acquisition by transcription-independent mechanism at the zebrafish midblastula transition, 131-142, Copyright (2009) with permission from Elsevier. Full text @ Dev. Biol.