
|
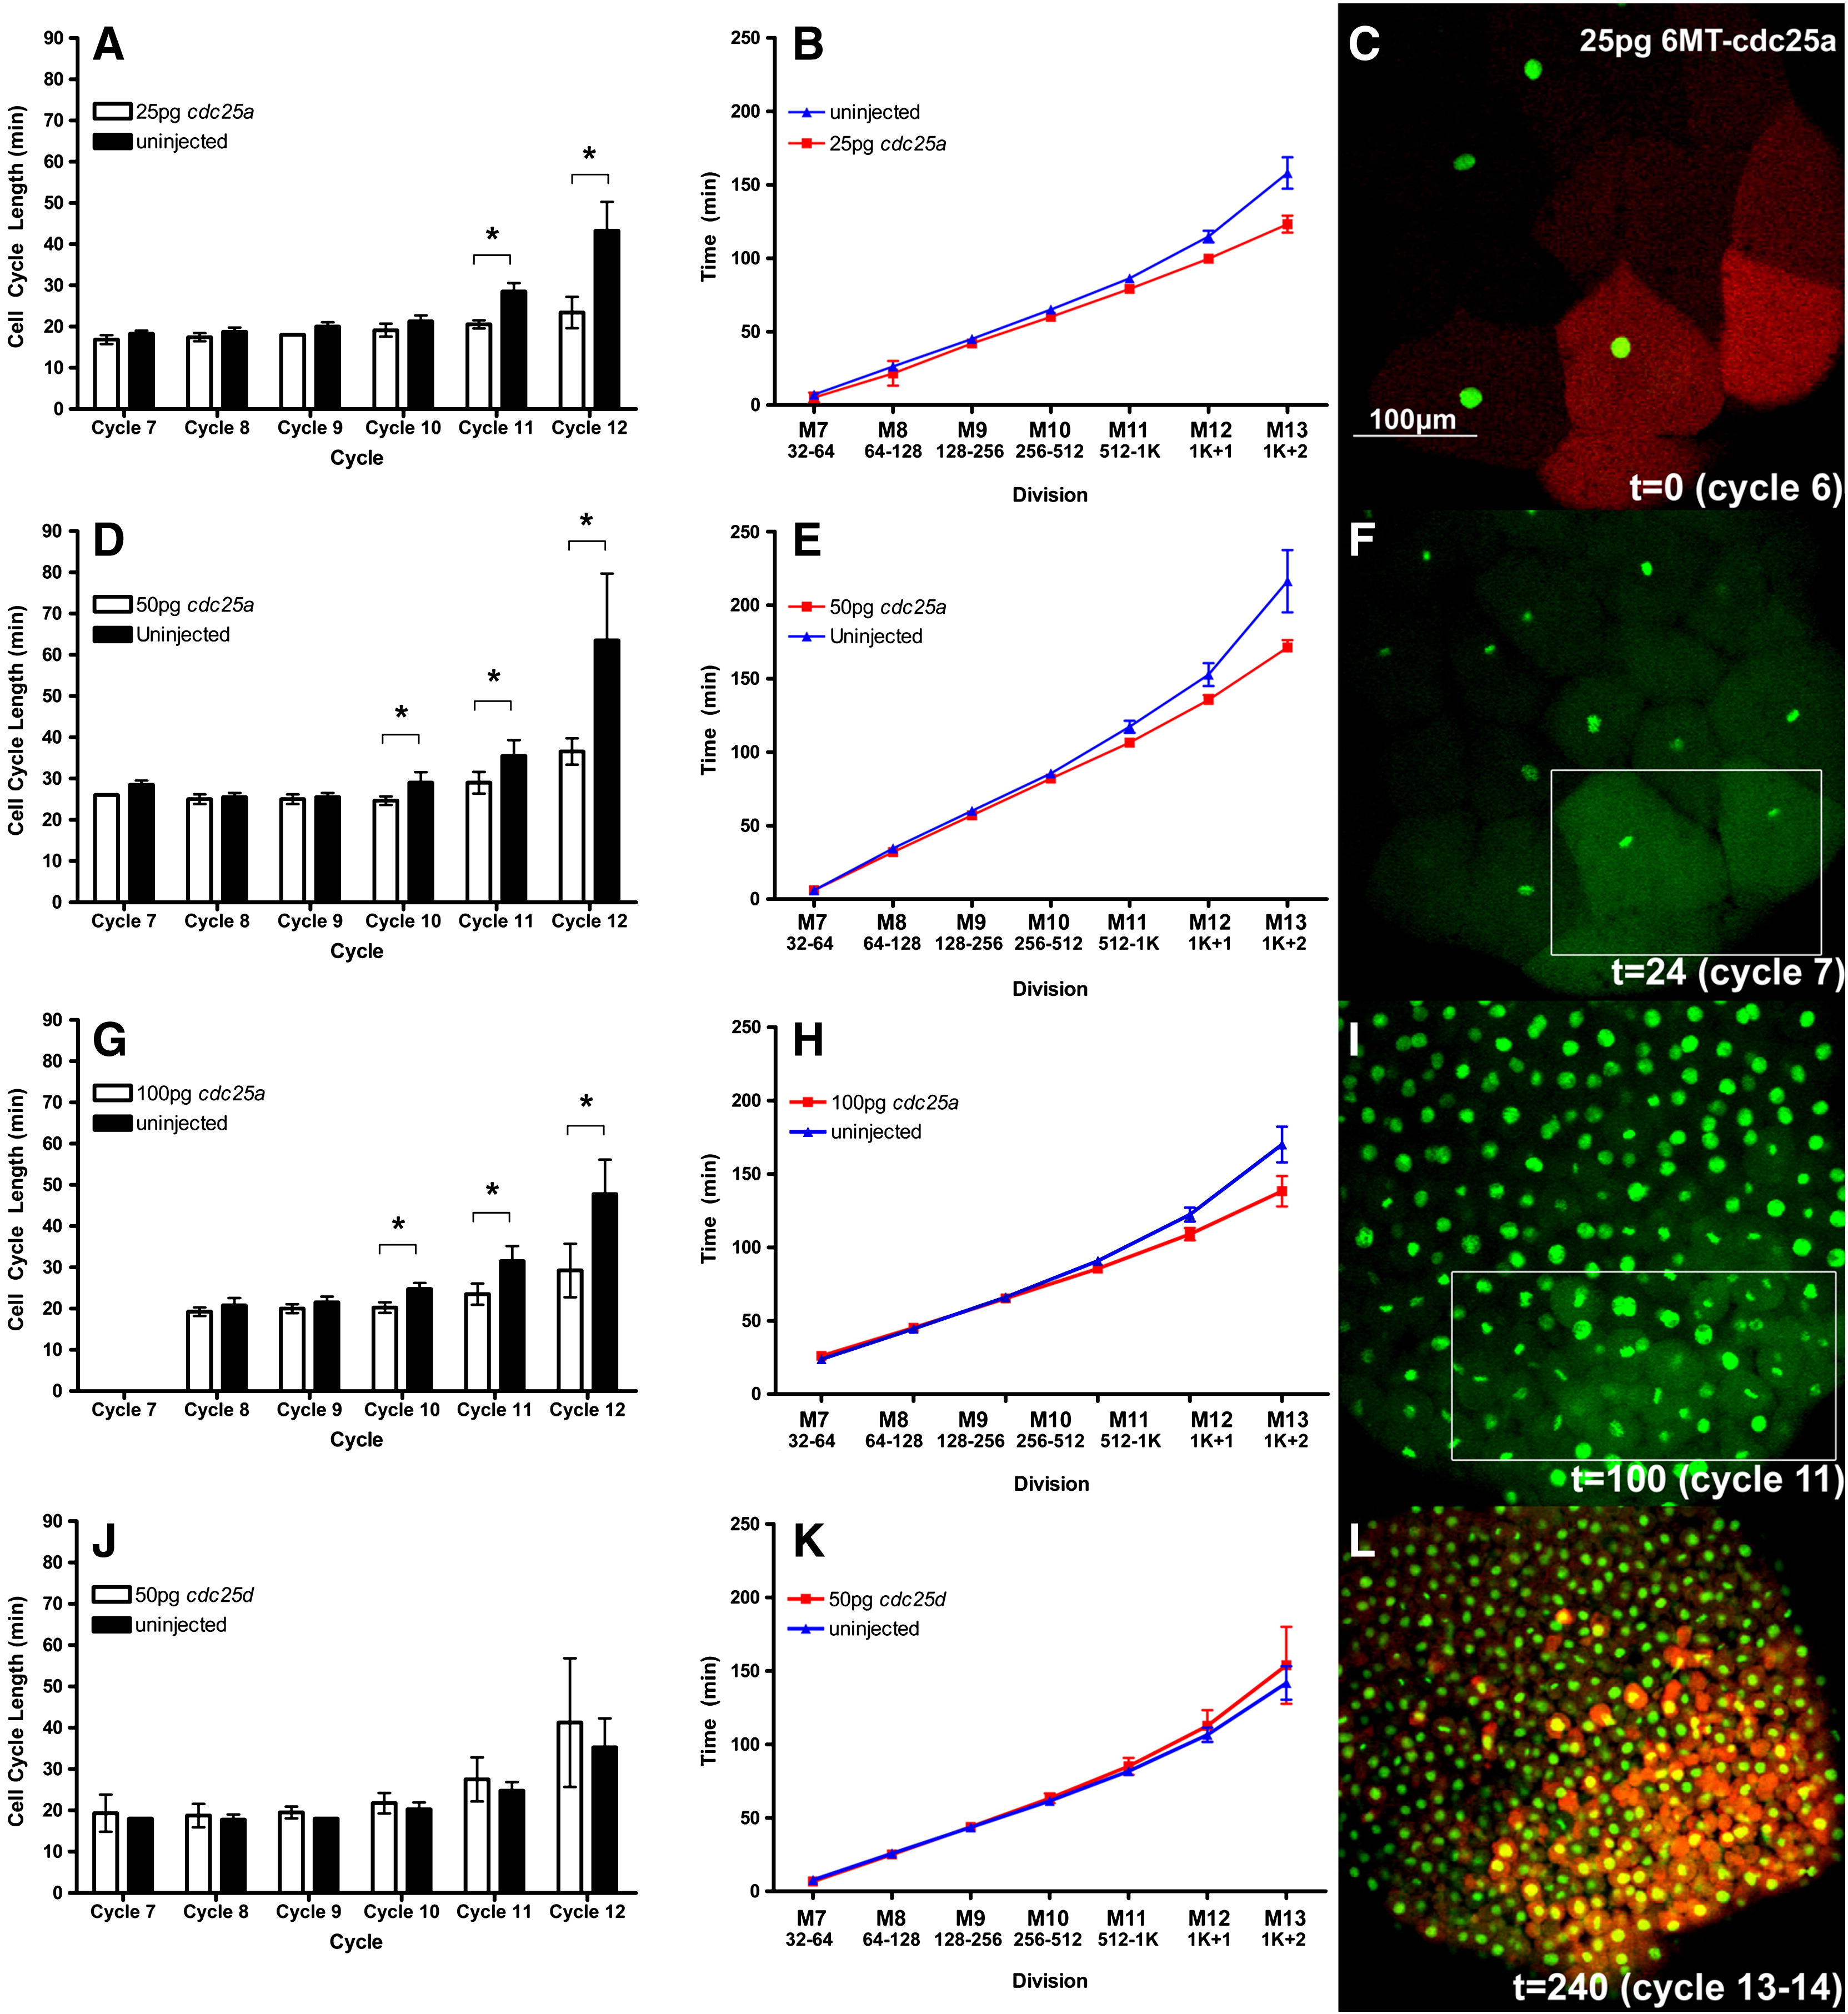
Fig. 3 Time-lapse analysis of cell cycle lengthening in embryos injected with Alexafluor-488 labeled Histone (green in C, F, I and L) and clonal injection of rhodamine dextran with 25 pg (A, B), 50 pg (D, E) or 100 pg (G, H) mRNA encoding 6MT-cdc25a or 50 pg 6MT-cdc25d (J, K). Open bars (A, D, G, J) or red lines (B, E, H, K) are injected cell lineages and filled bars (A, D, G, J) or blue lines (B, E, H, K, E–H) are uninjected control cells. Panels C, F, I and L are frames from a time-lapse movie of an embryo injected with 25 pg 6MT-cdc25a mRNA and rhodamine-dextran. Panels C and L are initial and final frames showing the rhodamine-dextran signal. White boxes in panels F and I indicate the approximate location of the injected clone. Brackets and asterisks indicate that differences between injected and uninjected cell cycle lengths are statistically significant (p < 0.05).
Reprinted from Developmental Biology, 326(1), Dalle Nogare, D.E., Pauerstein, P.T., and Lane, M.E., G2 acquisition by transcription-independent mechanism at the zebrafish midblastula transition, 131-142, Copyright (2009) with permission from Elsevier. Full text @ Dev. Biol.