
- Title
-
Development of diverse lateral line patterns on the teleost caudal fin
- Authors
- Wada, H., Hamaguchi, S., and Sakaizumi, M.
- Source
- Full text @ Dev. Dyn.
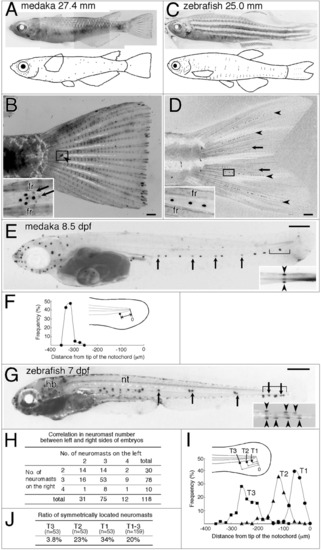
Distribution of neuromasts on the caudal fins of medaka and zebrafish. A-C: Adult phenotypes visualized by DiAsp staining. The whole body with representative drawings (A,C) and the caudal fins (B,D) are shown for medaka (A,B) and zebrafish (C,D). Higher magnifications of the boxed regions are shown in insets. Neuromasts on the opposite (right) side of the caudal fin are detected as weak signals (arrows). Lateral views; anterior is to the left. fr, fin ray. E-G,I: Embryonic phenotypes. The hatched fry of medaka (E) and zebrafish (G) are stained with DiAsp. In zebrafish Isl1-GFP line, green fluorescent protein (GFP) expression is also detected in hindbrain (indicated as hb) and neural tube (nt). Insets show ventral views of the prospective caudal fin region (brackets) of the same embryos. Arrowheads indicate the terminal neuromasts. Arrows indicate neuromasts on the opposite side of the embryos. Position of the terminal neuromast is quantified in medaka (F) and in zebrafish (I, in case of three neuromasts). Positions are shown as distances from tip of the notochord (drawings in F and I). H,J: Variability in number and position of terminal neuromasts in zebrafish. H: There was no correlation in number of terminal neuromasts between the left and right sides of the body. J: Ratio of neuromasts that are located symmetrically (difference in position is less than 10 μm in length between both sides of each embryos) is shown in case of three neuromasts (T1-3, correspond to that of a drawing in I). Scale bars = 500 μm in B,D,E,G. |
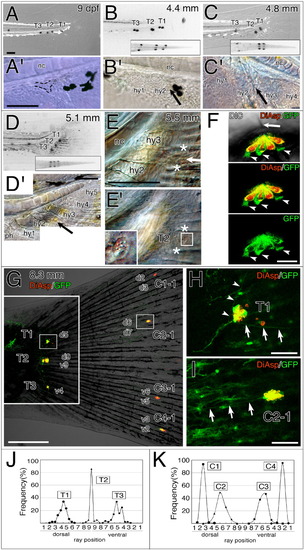
Positioning of the terminal neuromasts in zebrafish. A-E: Repatterning of the terminal neuromasts during caudal fin formation. Stage or body length of the fry is indicated in each panel. Terminal neuromasts (T1-3) are identified by DiAsp staining and morphological structures (hy1-5 indicate hypural bones 1-5; A-D) visualized under differential interference contrast (DIC) optics (A<′-E′,E). Position of the ventral loop of the caudal vein is indicated by the dotted line (A′) and arrows (B′-D′,E). Asterisks in E and E′ indicate positions of fin rays encompassing the middle neuromast T2. Inset in E′ indicates higher magnification of the boxed region. All panels are lateral views except for insets in B-D, which show ventral views. nc, notochord. F-J: Terminal neuromasts and the nerve innervations after the caudal fin formation. F: Confocal images of a neuromast in an Isl1-green fluorescent protein (GFP) transgenic fish stained with DiAsp. Isl1-GFP (green) is expressed in the cells surrounding the DiAsp-positive hair cells (red) and in the apical region of the neuromast. Lateral views; arrow indicates kinocilia; arrowheads indicate the presumptive support cells (see text for details). G: Confocal image of the caudal fin. Two images with different focal planes are shown. Position of the fin rays is indicated as d (dorsal) and v (ventral). H,I: Higher magnifications of the boxed regions in G for the terminal neuromast (H) and the caudal lateral line (CLL) neuromast (I). Isl1-GFP expressing axons bifurcate from the root of the lateral line nerve innervating T1 (H). Arrowheads and arrows indicate the collateral branches projecting to C1-1 and C2-1, respectively. J,K: Positions of the terminal neuromasts (J) and the CLL neuromasts (K) were quantified relative to the position of fin rays (ray position is described in G). Scale bars = 100 μm in A-E, 500 μm in G, 50 μm in F,H,I. EXPRESSION / LABELING:
|
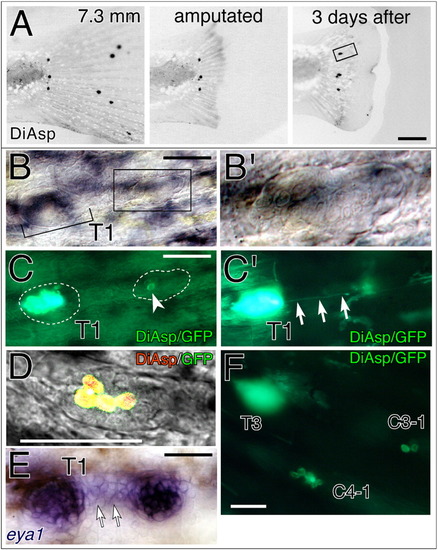
Accessory neuromast formation of the terminal neuromasts in zebrafish. A: Embryos were analyzed 3 days after amputation of the caudal fin. B,B′: The boxed region of the lower panel in A is shown under differential interference contrast (DIC) optics. Higher magnification of the regenerated caudal lateral line system (CLL) neuromast is shown in B′. C,C′: The same region as B is shown under fluorescent illumination (C) with a deeper focal plane (C′). Positions of the founder neuromast and the budding neuromast are indicated by dotted lines. Arrowhead indicates DiAsp-positive hair cells. Arrows indicate the extending lateral line efferent nerve. D: Confocal image of a budding neuromast. The fluorescent image is superimposed over the DIC image. E: The same sample as A-C was analyzed by in situ hybridization using eya1 RNA probe. Eya1 mRNA is expressed in the cells between the founder neuromast and the regenerated neuromast (arrows). F: Example of a single terminal neuromast (T3) extending two prospective CLL neuromasts (C3-1 and C4-1) during the regeneration process. Scale bars = 500 μm in A, 50 μm in B-F. EXPRESSION / LABELING:
|
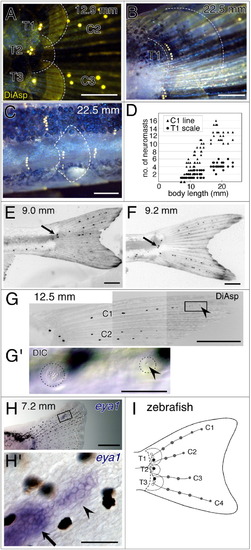
Development of neuromast patterns in adult zebrafish. A: Scales develop in the region corresponding to the three terminal neuromasts. Each terminal neuromast gives rise to a row of accessory neuromasts on the scale. Scales are outlined by dotted lines. B: The accessory neuromasts propagate dorsoventrally on the scale. C: Rows of accessory neuromasts in the tail region (stitches). D: Increase in number of neuromasts per row on the scale (circles, T1-associated scale), and number of neuromasts per line of the caudal lateral line system (CLL; triangles, C1) during postembryonic development. E,F: Examples of neuromast patterns in zebrafish that possess two (E) or four (F) terminal neuromasts on one side of the caudal fin. E: Both terminal neuromasts (indicated by arrow) are colocalized on the dorsal scale. In these cases, the C3 and C4-CLL neuromasts are absent in the ventral region. In this sample, the terminal neuromast is absent in the ventral region on both sides of the caudal fin (2 out of 65 fish showed this phenotype). F: Two of the four terminal neuromasts (indicated by arrow) are colocalized on the middle scale. In these cases, neither neuromast extended beyond the CLL, resulting in four lines of the CLLs on the caudal fin. G: Newly developing CLL neuromast (indicated by arrowhead) in the distal region of the caudal fin. G′: Differential interference contrast (DIC) image of the boxed region in G, showing that the newly differentiated CLL neuromast, which carries two kinocillia (arrowhead). H,H′: Eya1 mRNA expression identifies a budding structure (arrowhead) from the distal-most CLL neuromast (arrow). Higher magnification of the boxed region is shown in H′. I: Schematic drawing of the zebrafish caudal fin. Terminal neuromasts (black dots) generate two types of accessory neuromasts; lines on the caudal fin (CLL neuromasts, gray dots) and rows on scales (white dots). Projection of the lateral line nerve is shown by gray lines. Positions of the scales and caudal margin of hypural bones are indicated by lines and dotted lines, respectively. Scale bars = 500 μm in A-C,E-H, 50 μm in G′,H′. EXPRESSION / LABELING:
|