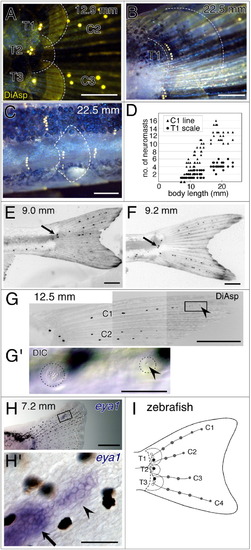
Development of neuromast patterns in adult zebrafish. A: Scales develop in the region corresponding to the three terminal neuromasts. Each terminal neuromast gives rise to a row of accessory neuromasts on the scale. Scales are outlined by dotted lines. B: The accessory neuromasts propagate dorsoventrally on the scale. C: Rows of accessory neuromasts in the tail region (stitches). D: Increase in number of neuromasts per row on the scale (circles, T1-associated scale), and number of neuromasts per line of the caudal lateral line system (CLL; triangles, C1) during postembryonic development. E,F: Examples of neuromast patterns in zebrafish that possess two (E) or four (F) terminal neuromasts on one side of the caudal fin. E: Both terminal neuromasts (indicated by arrow) are colocalized on the dorsal scale. In these cases, the C3 and C4-CLL neuromasts are absent in the ventral region. In this sample, the terminal neuromast is absent in the ventral region on both sides of the caudal fin (2 out of 65 fish showed this phenotype). F: Two of the four terminal neuromasts (indicated by arrow) are colocalized on the middle scale. In these cases, neither neuromast extended beyond the CLL, resulting in four lines of the CLLs on the caudal fin. G: Newly developing CLL neuromast (indicated by arrowhead) in the distal region of the caudal fin. G′: Differential interference contrast (DIC) image of the boxed region in G, showing that the newly differentiated CLL neuromast, which carries two kinocillia (arrowhead). H,H′: Eya1 mRNA expression identifies a budding structure (arrowhead) from the distal-most CLL neuromast (arrow). Higher magnification of the boxed region is shown in H′. I: Schematic drawing of the zebrafish caudal fin. Terminal neuromasts (black dots) generate two types of accessory neuromasts; lines on the caudal fin (CLL neuromasts, gray dots) and rows on scales (white dots). Projection of the lateral line nerve is shown by gray lines. Positions of the scales and caudal margin of hypural bones are indicated by lines and dotted lines, respectively. Scale bars = 500 μm in A-C,E-H, 50 μm in G′,H′.
|
