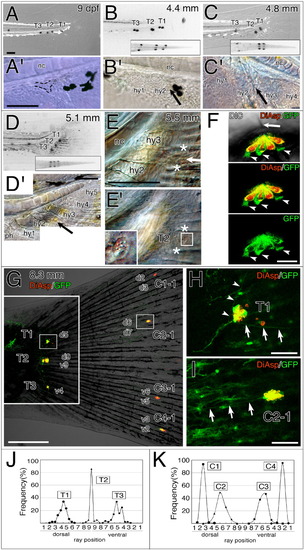
Positioning of the terminal neuromasts in zebrafish. A-E: Repatterning of the terminal neuromasts during caudal fin formation. Stage or body length of the fry is indicated in each panel. Terminal neuromasts (T1-3) are identified by DiAsp staining and morphological structures (hy1-5 indicate hypural bones 1-5; A-D) visualized under differential interference contrast (DIC) optics (A<′-E′,E). Position of the ventral loop of the caudal vein is indicated by the dotted line (A′) and arrows (B′-D′,E). Asterisks in E and E′ indicate positions of fin rays encompassing the middle neuromast T2. Inset in E′ indicates higher magnification of the boxed region. All panels are lateral views except for insets in B-D, which show ventral views. nc, notochord. F-J: Terminal neuromasts and the nerve innervations after the caudal fin formation. F: Confocal images of a neuromast in an Isl1-green fluorescent protein (GFP) transgenic fish stained with DiAsp. Isl1-GFP (green) is expressed in the cells surrounding the DiAsp-positive hair cells (red) and in the apical region of the neuromast. Lateral views; arrow indicates kinocilia; arrowheads indicate the presumptive support cells (see text for details). G: Confocal image of the caudal fin. Two images with different focal planes are shown. Position of the fin rays is indicated as d (dorsal) and v (ventral). H,I: Higher magnifications of the boxed regions in G for the terminal neuromast (H) and the caudal lateral line (CLL) neuromast (I). Isl1-GFP expressing axons bifurcate from the root of the lateral line nerve innervating T1 (H). Arrowheads and arrows indicate the collateral branches projecting to C1-1 and C2-1, respectively. J,K: Positions of the terminal neuromasts (J) and the CLL neuromasts (K) were quantified relative to the position of fin rays (ray position is described in G). Scale bars = 100 μm in A-E, 500 μm in G, 50 μm in F,H,I.
|
